The picture (png) (jpg) is based on data covering the years 1981-1985 from table 8.1 in Rein Taagepera & Matthew S. Shugart: Seats and votes: the effects and determinants of electoral systems, Yale University Press, 1989. However, we have added 2002-2005 data from ElectionWorld.org, namely:
The original data were:
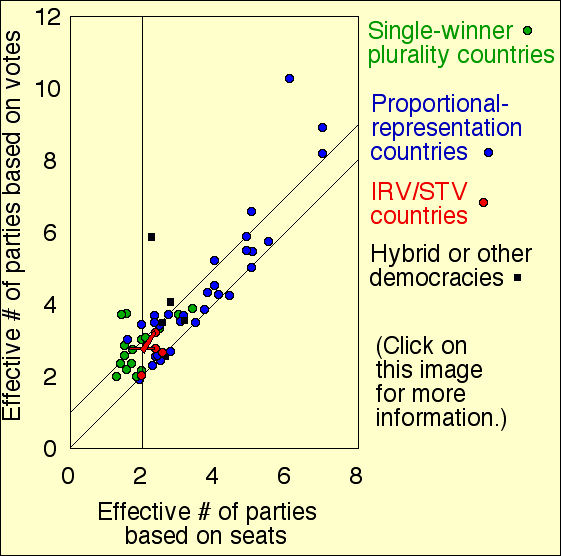
All data lower houses only. The vertical line represents exactly two equal-seats parties and as you can see almost all the plurality (green) datapoints lie to its left, representing 2-party domination. If another vertical were to be drawn at ENPPseats=1, that would represent single-party domination, i.e. "tyranny." As you can see, several plurality countries are edging dangerously close to that imaginary line. The lower diagonal line is the line of perfect proportional representation. Most countries lie above that line indicating a departure from proportionality due to minorities being squeezed out of power. (Note: number of parties based on seats is what counts. The amount by which the ENPPs based on votes is larger, merely is a measure of voter futility.) The upper diagonal line is a better fit to reality and represents exactly "one party effectively vanishing."
The "effective number of political parties" (ENPP) is the reciprocal of the sum of the squares of the seat (or vote) fractions got by the parties.
(Want still more data? See Arend Lijphart: Democracies Yale Univ. Press 1984, tables 7.3 and 8.4.)
Second, South Africa seems in 2004 to be – remarkably for a PR country – under (<2)-party control – it is the left-bottom-most blue data point at (1.97, 1.97). In the 1980s, the S.Africa data point was the other most-left-bottom point. Both seem to be invading the green plurality country regime and far from their home blue PR regime. At least at present that is because S.Africa let the blacks have power in the early 1990s and their party the ANC then quickly dwarfed all the others. (Really there is the ANC and a lot of small white-dominated parties, a combination which the ENPP formula views as "1.97 effective" parties.) Ultimately I predict (or hope) that race will cease to be such a giant feature in South African politics, at which point the ANC probably will split up into many parties.
For a somewhat more sophisticated look at "exceptions" to Duverger's law, see W.H.Riker: Number of political parties, re-examination of Duverger's law, Comparative Politics 9,1 (1976) 93-106 where he argues that really, Duverger should be rephrased to say that once 2-party domination locks in it stays that way, but various random effects and transitions may need to happen before the lock-in occurs. (He explains and has a model.) With this revised wording/model, Riker doesn't know of any exceptions anymore.