(Executive Summary) (skip to conclusions)
With plurality voting, your ballot can be invalidated by voting for two candidates (overvoting).
With instant runoff voting, there are more ways to go wrong. E.g. you can co-rank two candidates at any level of the ranking, skip a ranking-level, etc. So it seems "obvious" there are going to be higher ballot spoilage rates with IRV than with plurality.
With range and approval voting, there are fewer ways, in fact many would say no ways, to go wrong, because every way to vote or to fill out numbers within the permitted range, is a valid vote. So you similarly might expect range and approval voting to have lower spoilage rates than plurality.
All that, however, is just a theory. The real proof of the pudding is the experiment. As PhD advisors are fond of saying to their poor graduate students, "Show me the data!".
According to official plurality-vote totals: Florida's ballot spoilage rate in 2000 was 3%, and for the US nationwide 2000 presidential election, 1.9 million ballots were spoiled and hence uncounted versus 105 million that were counted, for a spoilage rate of 1.8%.
However, the distribution of invalid ballots in the USA is uneven: USA Today reported that voters in Florida's majority-black precincts were four times as likely to have their 2000 ballots invalidated than white precincts: 8.9% versus 2.4%. Among the 100 precincts with the highest numbers of disqualified ballots, 83 were majority-black. Allan Lichtman (history professor at American University) conducted a study of ballot rejection rates in Florida for the US Commission on Civil Rights. He found that overall, there was enormous difference in the rate of white votes and African-American votes counted in Florida. When one looks at the variation in the ballot spoilage rates for each Florida county, about one-fourth of the variation can be explained solely by knowing how many African American voters were registered there. Controlling for the number of high school graduates and literacy failed to diminish this relationship. For the entire state, the rate of spoiled ballots for African Americans was 14.4% while it was 1.6% for non-African Americans. The US Commission on Civil Rights subsequently claimed that, in 2000 Florida, 54% of the ballots discarded as "spoiled" were cast by African Americans, who were only 11% of the voters.
And here are some spoilage rates from other countries:
| Country | %invalid |
|---|---|
| Mexico 2006 presidential (5 major candidates) | 2.16% |
| Yugoslavia 2000 (5 major candidates) | 3.03% |
| Taiwan 2004 | 2.5% |
| Taiwan 2000 | 1% |
| Russia 1996 | 1.0 to 1.6% |
| France 2002 Presidential | 3.5% |
| France 2007 Presidential | 2.9% |
In California, 1.59% of ballots for governor went uncounted in 1997, and 1.8% of presidential ballots went uncounted in 2000, but only 0.97% of ballots for governor went uncounted in 2001. The 2001 decrease was attributed to new voting machine protocols which immediately reported invalid ballots to voters to give them the option of correcting them.
Although in our 2004 range voting exit-poll study (#82 here) we did not collect enough data to get a statistically significant prediction of ballot-spoilage rates, nevertheless we shall report our data for whatever it is worth. It is possible to draw some statistically significant conclusions.
Out of 54 range vote ballots in which we demanded the voters fill in every score slot with a numeric score (no Xs – intentional blanks – allowed) one score on one ballot was unclear. That is a total ballots-with-problems rate of 1.9%. However, by using all the other 6 scores on that 7-candidate ballot and regarding the unclear one as an X, our unused-score rate is only 0.026%.
Out of 68 range vote ballots in which we allowed blank scores, there were zero errors (but 5 voters refused to fill in their ballots at all for privacy reasons). That is a total ballots-with-problems rate of 0%. (Of course, it makes sense that allowing blanks would reduce the error rate.)
Despite the paucity of our data, it is actually possible to turn the per-entry error figure into a statistically significant weakened conclusion by using Poisson statistics. The calculations are as follows. First, our observed per-entry range error rate based on a single error in 117 ballots each with 7 entries, was 1/(117×7) which is a factor of 14.8 smaller than the US nationwide 1.8% plurality per-race spoilage rate. Second, if our true error rate were 3 (or fewer) times smaller than the plurality rate, the probability we would have observed at most one error, would have been at most 5.93e-4.93=4.2%. Third, if our true error rate were 2 (or fewer) times smaller than the plurality rate, the probability we would have observed at most one error, would have been at most 8.4e-7.4=0.51%. Therefore, with 96% confidence we can say that the range per-entry error rate is at least three times smaller than the plurality per-race error rate, and with 99.5% confidence we can say that the range per-entry error rate is at least twice as small as the plurality per-race error rate.
Why does range-voting have a much smaller per-entry error rate than plurality's per-race error rate? One might conjecture that the very "complexity" of having to fill in a number for each candidate makes the voter pay more attention; another conjecture would be that the repetition involved – you fill in a number next to every candidate – makes errors less likely. (In contrast, in many US punch-card-based plurality elections, the voter has to find punch-hole 53, randomly located somewhere on a card, corresponding to a candidate on a separate ballot where it says: "punch hole 53." This is a one-time, error-prone operation.) Range voting may seem more "complicated" than plurality at first glance, but what the data is saying is, that impression is misleading, since the so-called complexity in this case actually helps voters.
Much more range voting data – 1752 ballots – became available thanks to the government-sponsored French Range Voting study. It entirely confirmed all the conclusions discussed here from our own smaller and less-good study above, and now is enough data to make all the conclusions statistically significant.
| Place | %invalid |
|---|---|
| Victoria | 4.10% |
| Northern Territory | 4.45% |
| New South Wales | 6.12% |
| Queensland | 5.16% |
| Western Australia | 5.32% |
| South Australia | 5.56% |
| Tasmania | 3.59% |
| Australian Capital Territory | 3.44% |
| Nationwide average | 5.18% |
Later note: I do not have state-based data for other years, but it may be that 2004 was an atypically bad year for ballot spoilage in Australia, since the nationwide average figures for other years were
  election        invalid-ballot rate
=============     ===================
24 Nov. 2007      3.95% national invalid rate,
10 Nov. 2001      4.82%
 3 Oct. 1998      3.78%
 2 March 1996     3.2%   (turnout 95.77%)
13 March 1993     2.97%  (turnout 95.75%)
Time-avg (93-07)  3.98%
But it seems even a good year for Australia has comparable ballot spoilage to a pretty bad year for a plurality-voting country.
Ireland holds its presidential elections using the IRV system, an event of low interest because the position is largely powerless and ceremonial in nature, and often only one candidate runs unopposed. (7 year terms.) In the 1997 election, which was the last contested one (according to http://www.electionsireland.org and the Binghampton elections archive), Mary McAleese won in a 5-candidate race. (In the first rounds 3 candidates were eliminated and then McAleese beat Banotti in the final round by 706259 to 497516.) The total number of votes which failed to transfer to these two final candidates, i.e. which were not counted in the final round, was 66061 out of 1269836 cast, i.e. 5.2% invalid. Also, there were 0.80% "spoilt" ballots (which could not even be used in the first round) for a total of 6.0% ballots unuseable at some stage of the election process. However, this 6.0% figure is not really a true measure of the rate of invalid ballots because some of those 5.2% perhaps intentionally did not wish to specify a preference between McAleese and Banotti, as opposed to having it discarded due to an error. In 1990 the same websites report Mary Robinson won in a 3-candidate election with 1574651 "valid" and 9444 "spoilt" votes, which is a tiny 0.60% spoilage rate. But in addition to these "spoilt" votes there were 25548 votes which failed to transfer, i.e. failed to specify a preference between the final contenders Robinson and Lenihan, which is 1.62% and makes 2.22% when both kinds of spoilage are summed. All of these 1990 and 1997 numbers were larger than the exceedingly tiny spoilage rate (0.56%) in the 1973 election, which effectively was a plurality election since there were only 2 candidates.
Conclusion: Australia IRV ballots have far higher invalidity rates than the USA's and other countries' rates for plurality ballots above – every Australia area listed here did worse than every plurality country listed there. Also, although our Irish data may not be what you really want, as far as it goes it also indicates larger invalid-ballot rates in IRV than plurality contests within Ireland.
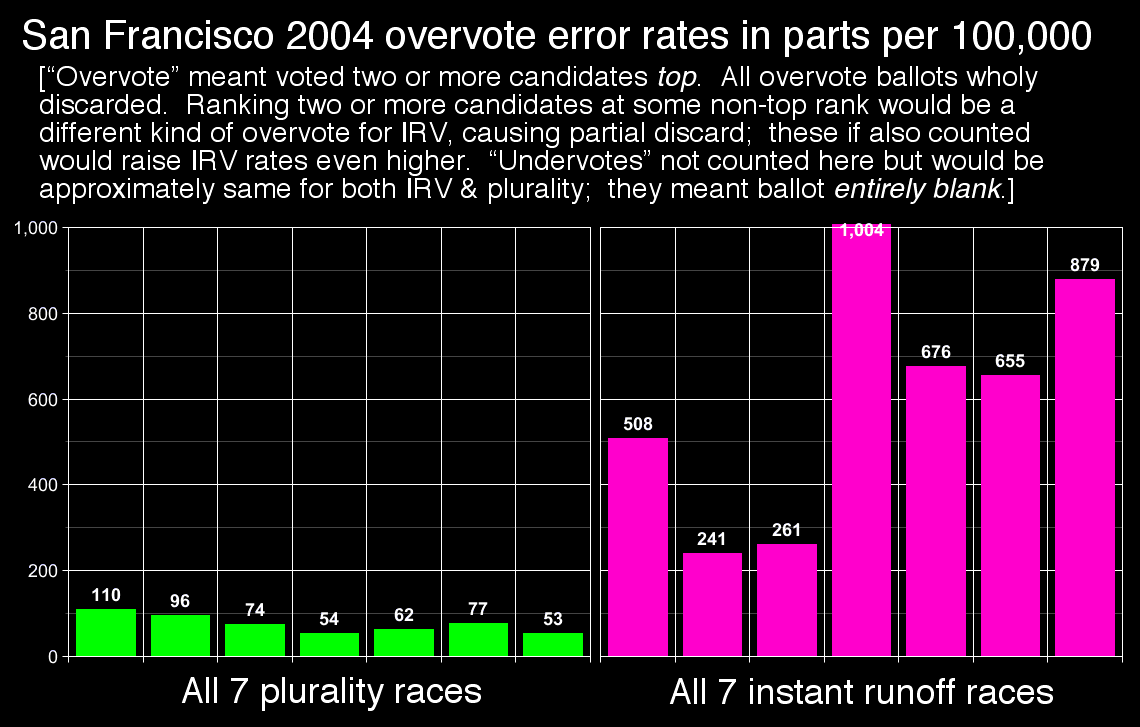
Table 1. Valid votes, overvotes and undervotes (also known as DROP-OFF) in IRV races:
Final official results from the SF Dept of Elections (www.sfgov.org/elections)
District | Total Voters | Overvotes + | Invalid ballots | Total valid ballots | |
| 1 | 30,721 | 156 (0.508%) | 1,778 (5.8%) | 1934 | 27,787 |
| 2 | 39,462 | 95 (0.241%) | 4,879 (12.4%) | 4974 | 34,488 |
| 3 | 28,317 | 74 (0.261%) | 2,338 (8.3%) | 2412 | 25,905 |
| 5 | 39,255 | 394 (1.004%) | 3,752 (9.6%) | 4146 | 35,109 |
| 7 | 34,905 | 236 (0.676%) | 3,030 (8.7%) | 3266 | 31,639 |
| 9 | 26,275 | 172 (0.655%) | 1,235 (4.7%) | 1407 | 24,868 |
| 11 | 24,902 | 219 (0.879%) | 1,507 (6.1%) | 1726 | 23,176 |
| Total | 223,837 | 1347 (0.602%) | 18,519 (8.3%) | 19866 | 203,971 |
(Total voters – Invalid ballots = valid ballots)
Overvote means a voter selected two or more candidates for their top
IRV ranking.
Undervote/drop-off means voter ranked nothing on their ballot.
Table 2. Undervotes/dropoff and overvotes in non-IRV (i.e. plurality)
San Francisco races:
Based on official data released 5 Nov. 2004. The report lacks about 80,000 absentee and provisional ballots that had not yet been counted.
Race | Voters | Undervotes/ Drop-off | Overvotes | % Overvote | Total valid ballots | |
President | 283,462 | 0.9% | 312 | 0.110% | 280,581 | |
US Senate | 283,462 | 7.0% | 273 | 0.096% | 263,229 | |
US Rep – 8 | 229,483 | 7.5% | 169 | 0.074% | 212,047 | |
US Rep – 12 | 53,979 | 11.4% | 29 | 0.054% | 47,776 | |
State Sen – 3 | 160,873 | 13.0% | 99 | 0.062% | 139,826 | |
State Ass – 12 | 122,445 | 15.9% | 94 | 0.077% | 102,910 | |
State Ass – 13 | 161,017 | 12.0% | 86 | 0.053% | 141,551 | |
Total | 1,294,721 | 8.1% | 1062 | 0.0820% | |
Overvote means a voter selected two or more candidates for the same office. Undervote/drop-off means voter selected no candidate for that race. In either IRV or plurality voting, undervoting has the same effect as not voting at all in that race.
So from this we see that the overvote error rates in San Francisco – same place, same time, same voters, just IRV versus plurality races – ranged from 3 to 11 times higher with IRV than with plurality voting, typically 7 times higher. (If double-ranking a non-top candidate in IRV were also considered – we haven't – then IRV overvote error rates would have been even higher.) And this conclusion is fully statistically significant.
Meanwhile, the undervotes and dropoffs probably mostly were "intentional" rather than "errors," but anyhow were comparable for both Plurality and IRV.
After Aspen Colorado adopted instant runoff voting for its Mayoral Election, the Aspen Times led off its article about the election [Janet Urquhart: Aspen's instant runoff voting quick but confusing, 6 May 2009] with
Aspen chose a mayor and two City Council members Tuesday in an election that left plenty of voters confused at the polls and equally mystified as the ballots were tallied in televised proceedings late into the evening.
The city's first use of instant runoff voting, which eliminated the need for a June runoff election, got mixed reviews at the polls. And the whirlwind runoffs after three hours of tallying votes left plenty of observers at a loss to explain exactly how the results were tabulated.
and quoted City Clerk Kathryn Koch as saying
There were 168 spoiled ballots Tuesday; two is typical.
Minneapolis MN adopted "ranked choice voting" (instant runoff in single-seat elections) holding the first such elections in 2009. To quote from the report Minneapolis commissioned to assess the results:
Of the 45,968 total ballots cast, there were 1,888 spoiled ballots and 2,958 voter error ballots, which indicates ballots with voter errors specific to Ranked Choice Voting, including overvote, repeat candidate, skipped ranking and undervote. Comparatively, during the general municipal election in 2005 [plurality voting], there were 755 spoiled ballots of the total 70,987 absentee and in-person voters...
The above numbers mean that in 2005 1.06% of all ballots cast were spoiled, as opposed to 4.1% in 2009. Additionally, 6.43% (2,958) of the ballots cast had errors specific to RCV. These ballots were ultimately counted [at least in the first IRV "round"] because voter intent could be ascertained.
...combined the two accounted for 7.49% of all the ballots cast... errors on nearly 7.5% of all the ballots cast are potentially troubling. Such a high error rate is significant enough that should it persist it could affect the outcome of elections in the future.
Here's some of the report's spoilage rate data split up by ward-by-ward comparing the spoilage rate before (2005) and after (2009) ranked-choice voting was enacted, in graphical form:
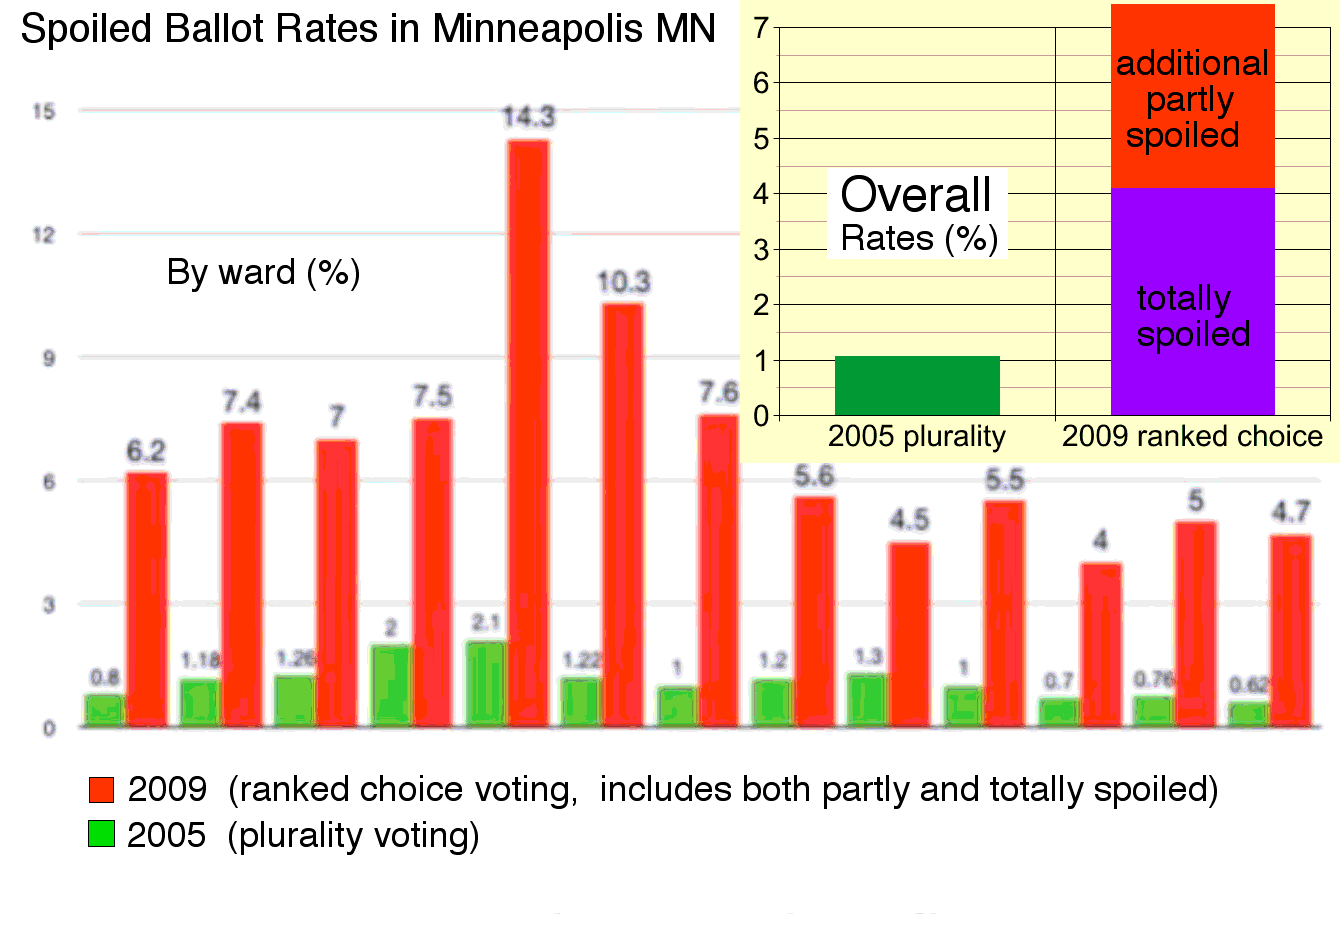
We thank Joyce McCloy for giving us this report, "SJVoter" for the ward-by-ward part of the graphic (from Minneapolis election dept data), and here's blogger Dale Sheldon-Hess ranting about continued mis-representation of this truth about Minneapolis by ranked-choice-voting propagandists.
Prof. Alan Sherman conducted an 'election' in a kindergarten using three different voting methods. 41 children voted in each. With plurality voting, there were 6 invalid ballots, i.e. 15%, or with a 1σ error bar (16±7)%. But both approval and range voting yielded no errors, i.e. (2±2)% each. ("Dog" won with all three voting methods.)
This exit-poll study of a few thousand real voters in two towns in several German elections in January 2008 and September 2009 found ballot spoilage rates of 0.07%, 0.14%, and 0.62%.
These compare favorably with the official nationwide spoilage rates of 1.7% in Sept. 2009 and 1.4% in 2005.
Based on our data, the ballot spoilage rate with range voting would be about one third of what it now is with plurality, in terms of the count of ballots-with-problems, and below 10% of what it now is, in terms of the entries-affected rate. These are fully statistically significant conclusions. And keep in mind that our voters had never range-voted before in their lives and did not have the benefit of voting machines – with experience and machines, range error rates presumably would improve even further.
With IRV in San Francisco 2004, the ballot spoilage rates were 7 times larger than under plurality voting, while in Minneapolis 2009 it got multiplied by a factor of 4 (and the rate of errors, i.e. including both spoiled and not-fully-spoiled ballots, got multiplied by a factor of over 10) – and these too are fully statistically significant. Australia in IRV races reports higher spoilage rates everywhere, than every entry in our collection of plurality countries' spoilage rates, but the increase is not a factor of 7, it is more like a factor of 2-to-6. One might conjecture this improvement versus San Francisco is due to the greater level of IRV experience the Australians possess.
One would expect Approval Voting also to be better than plurality since "overvoting" is a form of ballot spoilage that is no longer possible. And indeed due to its greater simplicity one might further expect (although one should beware of theoretical expectations) approval's error rates would also be below those for range voting. The only approval-voting spoilage-rate data I have – the French study and German study – had in the French case 10 spoiled ballots out of 2597 for an extremely low (0.385 ± 0.122)% spoilage rate. The German rates ranged from 0.07% to 0.62%. Those rates are an order of magnitude smaller than the spoilage rate in the official French 2002 plurality+top-2-runoff election happening simultaneously with the French exit-poll study (and also are 2 to 23 times better than the official German spoilage rates) and they are lowest spoilage rates ever observed among all the elections and studies recounted on this page. So these results certainly are consistent with our optimistic expectations.
In short: Approval Voting is better than Range Voting is better than Plurality is better than IRV with respect to ballot spoilage rates.
Each "better" here appears to represent a multiplicative factor between about 2 and 10 under otherwise-similar conditions.