Probable connection between approval voting and candidate-honesty
Warren D. Smith, Sept. 2016
Summary
It appears that the most-approved candidates in
approval-style polling
coincide with the most-truthful candidates according to fact-checking organizations.
Previously, it had been unclear why real-world approval voters approved or
disapproved candidates or what approval "meant" to them. This observation
may go a long way toward clarifying that, although further data, and possibly
then some refined rewording of the hypothesis, are desirable.
But our present data already is good enough to yield one to five "nines"
worth of confidence. We explain various confidence calculations and criticisms thereof,
eventually claiming confidence≥99.5% for our final
model versus the null hypothesis, which bound ought
to be immune to all the criticisms.
I am writing this in September 2016 in the midst of the 2016 US presidential race.
I noticed an interesting possible connection, see the data table below.
Candidate
H0 H1 H2 H3 H4 H5
FC
ApprovalRCP
ApprovalHP
AppNum
Hillary Clinton(DN)
2 11 15 22 28 22
249
42.3/52.3
41.6/56.2
0.775
Bernie Sanders(D)*
0 11 17 20 39 13
106
50.0/36.8
55.8/35.6
1.463*
Elizabeth Warren(Dx)*
0 0 11 11 33 45
9
28.0/26.3
25.2/27.1
0.997*
Joe Biden (Dx)
5 13 15 28 21 17
75
45.7/37.7
51.3/36.6
1.307*
Martin O'Malley(D)
0 6 17 56 22 0
18
17.5/27.0
--
0.648
Donald Trump(RN)
18 35 18 15 11 4
250
38.8/58.6
38.3/59.0
0.656
Ted Cruz(R)
7 27 31 13 16 7
114
29.7/54.8
23.8/54.8
0.488
John Kasich(R)*
5 13 14 16 28 25
55
39.1/30.0
37.4/37.7
1.148*
Marco Rubio(R)
3 15 23 22 24 13
142
36.3/40.3
34.9/46.0
0.830
Jeb Bush(R)
3 6 22 22 30 14
79
30.8/52.4
30.6/53.5
0.580
Rand Paul(R)
6 16 14 20 24 22
51
25.7/41.0
27.7/44.0
0.628
Chris Christie(R)
8 17 10 28 19 21
102
29.8/44.5
30.4/48.2
0.650
Rick Santorum(R)
8 27 20 22 12 10
59
24.0/42.0
19.9/46.3
0.510
Rick Perry(R)
11 18 18 25 14 15
169
21.0/39.3
23.6/43.5
0.538
Scott Walker(R)
6 24 15 19 23 13
172
23.5/29.3
33.7/37.4
0.852
Bobby Jindal(R)
0 10 0 40 40 10
10
18.7/30.3
17.1/35.9
0.547
Ben Carson(R)
14 43 25 11 7 0
28
--
36.3/45.4
0.830
Lindsey Graham(R)
0 17 17 33 17 17
12
--
16.3/42.1
0.387
George Pataki(R)
20 80 0 0 0 0
5
--
14.8/37.9
0.391
Mike Huckabee(R)
10 12 29 22 7 20
41
--
28.5/45.0
0.633
Carly Fiorina(R)
9 23 23 18 14 14
22
--
24.6/39.0
0.631
Jill Stein(G)
0 0 100 0 0 0
1
--
15.4/28.9
0.532
Gary Johnson(L)
0 33 33 0 33 0
3
--
24.1/28.9
0.834
KEY:
FC=Number of "facts" claimed by that candidate and
checked by "politifact.com, winner of pulitzer prize" as of 13 Sept. 2016.
Note: for the following 4 people politifact did not check enough facts; therefore
I have added all the facts checked by FactCheck.org for that candidate, along with
numerical ratings provided by me, to their totals:
George Pataki, Jill Stein, Gary Johnson, Elizabeth Warren.
Even then, still below 10 facts for each of them.
H0=Percentage of those facts given the worst "pants on fire" rating.
H1=Percentage given 2nd worst "false" rating.
H2=Percentage "mostly false."
H3=Percentage "half true."
H4=Percentage "mostly true."
H5=Percentage "true."
In parentheses: (D/R)=Democratic/Republican party candidate.
N=eventual nominee of that party.
x=never actually ran.
ApprovalRCP=Favorable/Unfavorable rating from USA-wide poll averages
compiled by RealClearPolitics.com, as of 13 Sept. 2016, mostly from
http://www.realclearpolitics.com/epolls/2016/president/favorable_unfavorable.html
ApprovalHP=same thing, but instead compiled by "HuffPost Pollster" as of 15 Sept 2016.
AppNum=numerical computation of the Fav/Unfav ratio (averaged if have two).
Asterisks: Candidate-name awarded a star (*) if he/she manages to attain ≥51%
"true" or "mostly true" rating from politifact.com. AppNum awarded asterisk if ≥1.00
(after rounding to two decimals) i.e. if candidate manages to get at least as
many "favorable" as "unfavorable" ratings.
Amazingly enough, the two kinds of asterisks happened to coincide. I.e,
the only two candidates (Sanders & Kasich) who got 51%-or-above honesty ratings from
politifact, also happened to be the only two who were more approved
than disapproved by the US public.
Is this just a fluke? Well, there are 21 candidates listed here,
hence 21×20/2=210 possible candidate-pairs. If honesty and approval were completely
unrelated, the chance the two pairs would coincide would be 1/210. (Actually, less,
since it did not have to be a "pair.") Therefore, we conclude with confidence>99.52%
versus the null hypothesis that this effect is real.
If we include also the two non-candidates (but the press acted as though they were
likely to be candidates for quite a while) Warren and Biden, then Warren also
would have gotten a double-*, albeit based on only 9 checked facts. (She has the
greatest True+MostlyTrue rating among those listed.)
But Biden would have only a single *.
So, all in all, if we consider adding Warren and Biden
we then would have 3 honesty stars and 4 approval stars among
23 candidates and close-to-candidates, with the honesty stars
forming a strict subset of the approval stars. Is this a mere coincidence?
If the two kinds of stars were wholy unrelated then considering
that the number of possible 4-element-subsets of 23 pseudo-candidates is
23×22×21×20/24=8855 and the number of such subsets that include
one particular triple is 20, this would again be a low-probability
(specifically chance=20/8855) event,
yielding 1-20/8855≈99.77% confidence versus the
null hypothesis that this is a real effect.
Conclusion: Depending which of 2 ways we calculate it, we get 99.5 or 99.8% confidence
based on this data that "candidate truthfulness" and "approval rating" are related.
This could be an important insight into approval voter behavior.
Meanwhile, the actual voting system used by the Dem/Repub parties to select their
nominees – which was not approval voting – produced results (e.g, their
nominees Clinton and Trump) far less correlated with honesty!
Trump was the single most-dishonest person tabulated among those with at least 30 checked
facts, with only 15% True+MostlyTrue (lowest by far) and 53% False+PantsOnFire (highest by far)
and an incredible 71% MostlyFalse+False+PantsOnFire.
Meanwhile, Clinton was about the 4th most honest among the 21 listed, but could not quite
manage to reach 51% True+MostlyTrue.
Also, if one examines the scores of candidates in plurality-style polls
and the official primary votes... then again, one sees far less correlation with
candidate truthfulness than one would find with approval-style voting – indeed
I doubt that any statistically significant connection is discernible.
Might the cause of all this merely be some sort of bias from that nasty evil organization
"politifact.com"?
Certainly their ratings are somewhat subjective (and I do not always
agree with them, and instances exist where
different fact-checking organizations disagree about the same
"fact"), and their choice of which "facts" to check may be somewhat manipulable.
To try to protect ourselves from that worry, we alternatively could consult other
independent fact-checking organizations. The book
Deciding What's True: The Rise of Political Fact-Checking in American Journalism
by Lucas Graves (Columbia University Press, Sept. 2016)
is helpful for learning
about that. Apparently the fact-checking entity is a fairly recent invention and it
may have been an American invention:
  Snopes.com – founded 1995
  Spinsanity – founded 2001, over 400 facts checked during 2004 US election, but ended
  FactCheck.org  – founded 2003 Annenberg public policy center at Univ. Pennsylvania;
            produces about 5 fact checks per week, supported by foundation philanthropy.
  Politifact.com – founded by St Petersburg Times / Congressional Quarterly in 2007,
     sold in 2009 to The Economist Group; checks about 20 facts per week making it
     the most productive fact checker (at least among USA-based ones if not worldwide).
  Washington Post fact checker – started September 2007, ended after 2008 campaign season,
     but revived in January 2011. Checks about 1 fact per day.
  CNN.com's "reality check" – not sure of its years of operation, but it has
    been checking Clinton & Trump during the latter part of the 2016 presidential campaign.
Internationally, we have
  "Pagella politica" and "Il politicometro" (both Italy)
  The Guardian "reality check" (UK)
  FactChecker.in  (India)
  MorsiMeter (Egypt)
  "El poligrafo" a fact-checking feature in "El Mercurio" (Chile) founded 2013
  Africacheck.org (Africa)
  French fact checkers:
    Decodeurs:  http://decodeurs.blog.lemonde.fr/
         http://www.lemonde.fr/les-decodeurs/        Founded by Le Monde in 2009
    Les Pinocchios:  http://tempsreel.nouvelobs.com/politique/les-pinocchios-de-l-obs/
    OWNI veritometre:   http://owni.fr/2012/02/16/veritometre-factchecking-presidentielle/
                http://owni.fr/2012/05/03/veritometre-debat-hollande-sarkozy/    etc.
    Desintox:  http://www.liberation.fr/desintox,99721
                           Founded by Cedric Mathiot for Liberation.fr in 2008
  Der Spiegel (Germany) also has perhaps the largest fact-checking team in the world.
Unfortunately for our purposes, "Factcheck.org" does not provide numerical truth-ratings
for checked facts nor summary ratings for candidates; they just provide lists
of individual facts, usually claimed by or about candidates.
(Anybody willing to work could tally them up and numerically rate them, however;
and they do index their facts by candidate-name and provide "annual reviews.")
The same problems pertain to "Fact checks of the 2016 election" by New York Times and
most or all of the international and other groups. (Further, e.g, MorsiMeter
focused solely on Morsi's campaign promises and not on fact-checking any of his rivals,
making it nearly useless for our purposes.)
"Fact checker at the Washington Post" does provide numerical "Pinocchio ratings"
with occasional summary tallies. Here is the summary they published on 15 July 2016.
   Candidate        4P  3P  2P   1P   0P   FC
  Donald Trump      63  21  10    2    2   52
  Hillary Clinton   13  36  30.5  5.5 14   36
KEY:
  4P = percentage of facts regarded as "4 Pinocchios" – outright whopper lies.
  3P = "3 Pinocchios" – "mostly false."
  2P = "2 Pinocchios" – "half true."
  1P = "1 Pinocchio" – "mostly true."
  0P = the coveted "Gepetto checkmark" – completely true.
  FC = total number of facts checked for that candidate.
As you can see the Washington Post agrees with Politifact that Clinton is
far more truthful than Trump, but appears to have a tougher standard in
that both Clinton and Trump score worse at Washington Post than they
score at Politifact. (I also think the Washington Post checks fewer facts than
Politifact, but the ones it checks, it checks more thoroughly.)
The Washington Post went further by claiming
that Trump was not merely the least-honest candidate in the 2016
race (that conclusion agrees with Politifact), but actually among
all major politicians in the entire history of the Washington Post's
fact-checking feature. Also amazing is this. Most politicians show a
unimodal distribution of honesty-scores, with, for example, Graham's peak
being at honesty level "H3" in our first data table. But in the case of Trump, his
frequency actually keeps increasing (at least in the view of Washington Post)
with more Pinocchios, up to the highest Pinocchio level the Post could conceive of!
FactCheck.org also found Trump to be
"The king of whoppers" on 21 Dec 2015 and noting
"in the 12 years of FactCheck.org's existence, we've never seen his match."
CNN's "reality check" one day after the first Clinton-Trump presidential debate
on 26 September checked claims made by both during that debate and my tally of their
checks (version of noon 27 Sept) was
   Candidate       IC  FA  TB  MT TR   FC
  Donald Trump      0  14   2   0  3   19
  Hillary Clinton   0   0   1   5  6   12
KEY:
TR=true; MT="mostly true"; TB="true but misleading"; FA=false; or IC="it's complicated."
CNN concluded "From misrepresentations to
half-truths and flat-out lies, Trump has talked around and away from
the truth more brazenly than any major party presidential nominee in
modern political history" agreeing with all the other fact-checking bodies.
This debate also was fact-checked by
Washington Post,
FactCheck.org,
and PolitiFact.
Note about Gary Johnson
The data tabulated above shows that (at least as of mid-September 2016)
the most-approved presidential candidate still running (based on
approval/disapproval ratio) was not Hillary R. Clinton, and not Donald J. Trump.
It was the Libertarian party's nominee (and former governor of New Mexico)
Gary Johnson.
Johnson was not permitted to participate in the Presidential Debates and got very
little media attention. He will undoubtably get only a tiny percentage of the
official vote on election day. Nevertheless it appears the USA currently wants him as
president more than any rival.
Despite that, I have no doubt that Trump will get more votes in the official
election on 8 Nov. 2016, than all his rivals (besides Clinton) combined.
This illustrates the massively distortionary nature of the USA's
plurality voting system.
A further confirmation of that is the following
pairwise poll
conducted by the Johnson/Weld campaign (nationwide sample, 1006, polled by
telephone on 8 & 9 October 2016).
Question 4: "For whom would you vote for president if the choice was between Republican
Donald Trump and Libertarian Gary Johnson?"
Results:
Johnson 41.6%, Trump 37.3%, Don't know 21.1%.
This margin is 43 more Johnson than Trump preferrers among the 1006 polled,
which naively would be at least 2.7σ,
where σ≤(√1006)/2=15.86 voters.
For those worried this poll should not be trusted – because it was released
by the Johnson/Weld campaign, not conducted by some independent entity –
some reassurance is provided by Question 1
("Do you have a favorable or unfavorable opinion of Gary Johnson?")
with result
Fav=15.2%, Unfav=30.0%, NoOpinion=38.1%, Never heard of GJ=16.7%.
This result is worse for Johnson than the ApprovalHP numbers from independent polls,
which is evidence against the hypothesis that the Johnson/Weld campaign released
an atypically Johnson-favoring poll. If anything, the opposite was true.
While it is true that Gary Johnson currently has the highest
approval/disapproval ratio, it is unclear how seriously that should be taken
because the US public is poorly informed about GJ compared to HRC and DJT.
(Indeed, only 53% of those polled in the HuffPost poll set
were able to express an opinion about him;
the remaining 47% said "don't know.")
If our elections were using approval, then the media and his rivals
would scrutinize GJ a lot more, everybody would be better informed, and then
his approval might change a lot in one or the other direction, perhaps
invalidating his frontrunner status.
Nevertheless it is totally clear GJ deserves far more attention than he got,
and deserves far more votes than he will get – the USA's present voting
system plainly is an absurd parody of democracy.
The preceding (USA 2012) Presidential election
This election was largely but not entirely independent of the USA 2016 race.
"Not entirely" because Perry and Santorum ran in both races. "Largely" because
all the major candidates in 2016 were a wholy-disjoint set from those in 2012,
i.e. Perry and Santorum both were minor.
2012 Candidate
H0 H1 H2 H3 H4 H5
FC
Apprv
Mitt Romney(RN)
9 18 17 28 18 15
206
475
Rick Santorum(R6)
8 27 20 22 12 10
59
430
Ron Paul(R)
8 20 13 20 20 20
40
610
Newt Gingrich(R)
15 20 20 24 13 8
75
325
Herman Cain(R)
12 42 15 19 12 0
26
430
Tim Pawlenty(R)
6 18 12 18 35 12
17
420
Jon Huntsman Jr.(R)
6 6 28 28 22 11
18
490
Michele Bachmann(R)
26 36 13 10 7 8
61
420
Rick Perry(R6)
11 18 18 25 14 15
169
345
Barack Obama(DN6)
2 12 12 27 28 21
572
525
NOTES:
6 inside the parentheses warns that candidate's politifact report card
honesty stats may include many statements they made not just in the 2012 race,
but also during the 2016 and/or 2008 races.
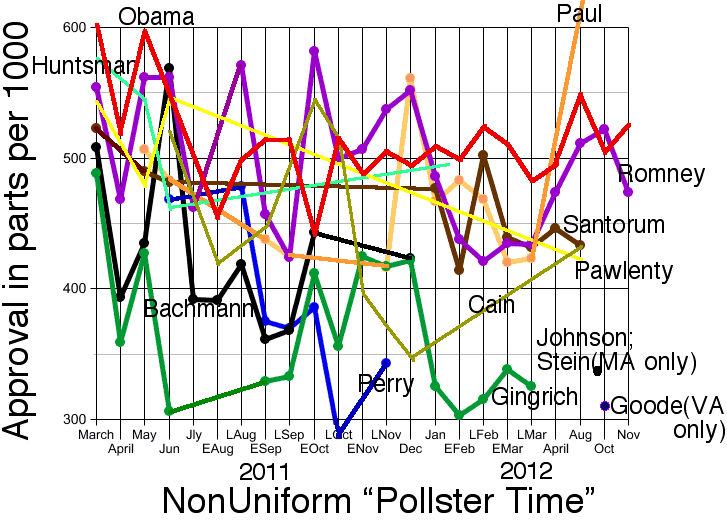
Approval gives favorable/unfavorable percentages expressed as 1000F/(F+U)
at latest date shown for that candidate in this multicolored approval-vs-time graph
which I'd created about 4 years ago from a large number of approval-style polls.
None of the 10 candidates listed managed to get True+MostlyTrue percentages ≥51%
according to Politifact; the highest three were Obama with 49%, Pawlenty 47%
(but that was based on only 17 facts checked), and Ron Paul with 40%.
Only two candidates got more approval than disapproval:
Obama and Paul.
Again, by an amazing coincidence, the two most-approved candidates
coincided with the two most-truthful candidates – at least, provided
the low-data candidate Pawlenty is ignored.
Pawlenty dropped out very early in the race, on 14 August 2011,
many months before the first vote in the first US state primary was cast and hence
in my view should not even be counted as a "candidate" at all. All the others stayed
in the race until at least two states had voted.
Also, considering Pawlenty's August 2011 drop-out date, arguably his June 2011 Approval poll
should be used instead of his August 2012 poll. If so, the problem disappears:
Pawlenty then becomes both the 2nd-most-approved candidate and 2nd-most honest, causing
the 3 most-approved and 3 most-honest (out of the 10 total) candidates to coincide, an amazing probability=1/120 event.
This amazing coincidence corresponds to a confidence level of 88 to 99%
depending on which of those three methods I use to compute it.
French 2012 Presidential election
The following table is based on fact checking by OWNI's "Veritometre."
There are two classes of facts checked: quantitative claims, and other.
For the 6 most important candidates in the race (e.g. they had the six highest approval ratings)
I am going to tabulate each candidate's correct/incorrect ratio
on quantitative claims,
ignoring claims that Veritometre called "en cours" (i.e. still unchecked;
apparently they planned to check those later but I do not know if that
ever happened) and for the present purpose I am going to count what
Veritometre calls "declarations imprecises" (meaning numbers
within ±10% but not within 5%) as "correct."
Our six candidates were exactly the six with over 100 quantitative
claims checked by Veritometre
as of 20 April 2012.
For the nonquantitative claims, Veritometre awarded "Pinocchios"
(the more Pinocchios, the more untruthful the candidate); and we also tabulate
the average Pinocchio-count for each candidate's other-facts collection.
Candidate
FC
Veritometre ratio correct/incorrect
Average Pinocchios
Approval
Fav/Unfav
Comment
Jean-Luc Melenchon
164
2.82
1.83 (23)
39.07%
45/46=0.978
Francois Hollande
215
2.71
1.97 (35)
49.44%
61/32=1.906
won
Eva Joly
107
1.86
2.20 (20)
26.69%
30/61=0.492
Nicholas Sarkozy
392
1.11
2.35 (34)
40.47%
49/48=1.021
also in runoff
Francois Bayrou
271
1.08
2.43 (23)
39.20%
48/42=1.143
Marine Le Pen
163
1.25
2.71 (21)
27.43%
33/62=0.532
KEY:
FC = #quantitative claims made by that candidate that they checked;
correct/incorrect ratio as described above
OWNI "Veritometre" fact-checking data:
http://owni.fr/2012/04/20/une-presidentielle-en-donnees/
"OWNI data journalists have checked nearly 1300 quantitative claims by
the presidential candidates – on employment, security, trade ...
Of all the statements we checked, 40.2% are correct, 41.6% are
incorrect and 18.6% turn out to be too vague."
Average Pinocchios: a different
set
of facts checked by Veritometre each were
awarded "Pinocchio counts" (more Pinocchios⇒more dishonest). For example
Melenchon's "1.83 (23)" means of the 23 facts claimed by Melenchon he got an
average of 1.83 Pinocchios.
Approval: in a pseudo-election exit poll study of 2340 voters
using approval-style voting. carried out by
Antoinette Baujard, Frederic Gavril, Herrade Igersheim,
Jean-Francois Laslier, and Isabelle Lebon and corrected by them for geographic
biases.
Fav/Unfav: IPSOS professional approval-voting-style France-wide poll 19 April 2012.
(Apparently by telephone with about 956 respondents.) I have also computed
their F/U ratio numerically.
Hollande not only won the official election (both first round, and runoff),
he also would have won with approval voting (either poll) and also apparently
would have been the "Condorcet beats-all winner" according to pairwise polls.
And Hollande was the second-most-truthful candidate, slightly behind Melenchon,
and was actually the most truthful within the statistical margin of error
in the truthfulness measurement [i.e. given that only 164, a finite number, of facts
were checked for Melenchon, if those facts were randomly chosen from a large pool, then
his truthfulness is only measurable to within error
at least about ±1 part in √164].
Warning: Concerning such "statistical errors in candidate-truthfulness estimates,"
keep in mind that fact-checkers actually choose the claims they check for each candidate in
a nonrandom manner, concentrating on more-interesting, more-emphasized,
more-requested, and less-obvious facts.
And even just a single big lie by a candidate can
cause many voters to despise him – and probably rightfully so – even though
if that were the only
fact checked for him, that would mean that candidate's truthfulness percentage
was very poorly measured indeed.
After France's first voting round, the runoff was to be between Hollande and
(the incumbent seeking re-election) Sarkozy.
Hence there was a Hollande-Sarkozy debate, and further fact-checking of statements
by Hollande & Sarkozy:
"Data journalists from OWNI
checked
132 statements by Nicolas Sarkozy or
Francois Hollande made during recent debates or speeches."
Veritometre gave a score of 56% correct to Hollande versus 44% for
the incumbent Sarkozy.
So our truthfulness↔approval connection arguably is supported
by Hollande's victory in France 2012, in the sense that he was the
second-most-honest candidate (and considering the statistical margins of
error, given the finite number of checked facts we have,
may actually have been the most honest).
This support is far less clear if we go to the next most approved
candidate – either Melenchon, Bayrou, or Sarkozy. All three were
comparably approved, within statistical margin of error;
but their truthfulnesses
differed considerably according to Veritometre.
So certainly our whole hypothesized connection is only partially supported by France 2012
(as opposed to USA 2012 or USA 2016 which pretty much fully supported it),
but nevertheless I would vaguely contend France 2012,
on overall balance, supports the hypothesis more than it opposes it.
Unfortunately, Veritometre for our table's column about correct/incorrect ratio
only checked numerical claims, and their ±10% cutoff,
while objective, probably does not have greatly relate to what voters care about.
For example a candidate who said "three million" when the correct number was
2.6 million would be rated "incorrect" by Veritometre – but speaking as a voter,
I probably would have been satisfied with that candidate's approximation.
Meanwhile, such blatantly false (according to several fact-checking entities
unanimously) claims by Donald Trump in the USA 2016 campaign, such as
"I opposed the Iraq war from the beginning,"
"Hillary Clinton started the 'birther' movement, but I finished it" and
"Hillary Clinton has been fighting ISIS her entire adult life"
would not matter to this Veritometre column at all since those were unquantitative
claims! But those claims probably would matter to voters!
On the other hand, Trump's pledge to spend at least $100 million of his own
money on his campaign
would
have been counted as a lie, albeit one only detectable afterwards.
This criticism might be overcomable by also obtaining fact-checking data from
Le Monde's "Les decodeurs." Unfortunately Le Monde
only has made Decodeurs archives available online starting soon after the 2012
election ended, so I haven't been able to investigate that. And Desintox
did not provide tallies and hence also was not very useful. Fortunately an
independent (?) collection of facts were checked one by one by Veritometre using
a "Pinocchio scale" over several months and their "average Pinocchio"
tallies were computed by
Vincent Flores –
albeit unfortunately the number of these
facts checked for each candidate remains 3-10 times
fewer than Politifact's corresponding fact-check-counts for the major USA 2016 candidates.
First try at a Conclusion
If we naively multiplicatively
combine the USA 2012 coincidence with the USA year-2016
coincidence (we also optionally could expunge the Santorum and Perry data from the 2016 race
to make 2012 and 2016 more-independent; this has little effect on our conclusions),
then we deduce combined confidence levels of between 99.94 and 99.996%
(depending on how calculated) that the following hypothesis is correct (versus
the null hypothesis)
HYPOTHESIS: The highest approvals happen only for candidates with high truthfulness.
If we also throw in Hollande in France 2012 that would bring us a further factor
of about 3 nearer to 100% confidence, reaching between 99.98 and 99.999%
confidence that highest approval is connected to highest truthfulness.
Incidentally, note that I chose these three elections simply because
they were the only major elections in human history
for which I could get both approval and fact-checker quantitative truthfulness data
for all the major candidates. But for a harder-working scholar than I,
it is conceivable that this might also be possible for
a couple more elections, such as USA 2008 or Chile 2013 (or in future, France 2017) –
or that more truthfulness data from an independent fact-checker
could be got for France 2012.
I consider this finding to be a further sign that approval voting is a good idea,
because I consider more-truthful presidents to be better. Why are they better?
Well, first of all, the whole ideal of "democracy" works better if everybody has
more information, and more-honest information.
Second, candidates lie either because they are unable to determine, or unwilling to state,
the truth. The former is likely to yield poor performance as president.
The latter ("strategic lying") might help a president in, e.g. negotiations, but only
in circumstances where whoever he is lying to, cannot
recognize that it was a lie. If the lie is detected, then it tends
to hurt, not help. But now consider that every lie we have tabulated was
detected as a lie.
Conclusion revisited in light of "p-hacking" worry
An early reader of this report, with expertise in statistics (who
shall remain nameless for the moment, unless he tells me to use his name)
claimed "[The] argument seems to be extensively 'p-hacked.'
(Unfortunately he didn't say why it 'seemed' that way.)
I have not closely investigated this, but I'd guess this is at the level of
'probably but not definitely meaningful' rather than the '99.999% confidence'
claimed. For more on p-hacking, google the 'crisis of replication'."
He concluded (to slightly paraphrase) this all was
"[probably worth publishing] but the exaggerated claims should be toned down."
Ouch.
My first reaction to this accusation
was to note that I had computed the confidences asociated with
the USA 2016 and USA 2012 elections each in two or three different ways.
This was done intentionally, not to do "p-hacking," but rather to make it
clear the confidences did vary depending on the precise statistical test chosen,
but not by enough to hurt us, i.e. we still get a lot of confidence even using
the least powerful among the three tests. (And by the way, these were the only tests
I tried, all were done manually, not with a computer, and were chosen mainly because
it was easy to compute them manually.)
However, I thought about it some more and think the complaint
deserves a better response than that. So: what is "p-hacking" and what should
one do about it?
Well, "p-hacking" is inherently a somewhat vague concept, but the rough idea is this. Suppose
you have some data. You want to deduce some impressive-sounding statistical conclusion
from it. So, you create (say) a computer program that tries N different statistical
tests on the data (and perhaps N=1000000). You then find the "most amazing"
test, from that ensemble,
which, viewed in isolation, would produce the greatest confidence, e.g. smallest "p-level."
For example, suppose that this most-amazing test produced p≤0.00001,
i.e. confidence≥99.999%, in some conclusion. Wow! You publish it and are acclaimed by
all as a great scientist who's discovered some Wonderful New Truth.
Unfortunately, if you behave that way, your conclusion is quite likely to be bunk.
If the N tests were all independent events,
then we'd expect 10 out of the 1000000 tests,
and therefore the one you chose,
to have p≤0.00001 even for meaningless fake data consisting entirely of random numbers.
Hence, your "confidence≥99.999% conclusion" really would mean nothing!
In practice, though, usually such a computer search would have been searching
among tests which were not at all "independent," e.g. they probably fell into at most
a few families, in which case the situation would not be nearly that bad... but there
still would effectively be confidence-exaggeration happening, it just would
be highly non-obvious a priori how much.
In particular, you could search a 1-parameter continuum family
of tests to find the "most amazing" parameter value; this has N=infinity,
but certainly in most practical applications that test result would not
be an infinite exaggeration!
In fact, we later are going to find
a maximum-likelihood 1-parameter model, and at the end of that section we shall explain
a way to justify it using a finite-N Bonferroni correction.
One way to protect yourself against this is to multiply your p-value
by N ("Bonferroni correction") as a "safety factor."
Which you trivially can do, if you know N.
This is always safe,
i.e. always conservative, in the sense that the new p-level is guaranteed
to upper bound the truth.
However, this often will be overprotection.
Now although my critic was using "p-hacking" in a pejorative way,
in fact some of this behavior is what you are supposed to do.
I.e. you are supposed to be intelligent in your choice both of statistical tests, and of
hypothetical theories of nature that you devise to test versus data. You aren't supposed
to be an idiot and choose some irrelevant-sounding test, or devise some
obviously dumb theory. (And if you weren't intelligent,
then you could use computer searching to effectively become
more intelligent.)
The problem only arises if you keep N secret and do not employ any Bonferroni
(or other appropriate) correction to stay safe.
Now let us return from the abstract to the particular situation here.
I devised only N=2 or N=3 tests (all variants of the same test actually, but
under some definitional changes of, e.g, who really was a "candidate")
for each of the two elections USA 2016 and USA 2012.
I chose the "≥51% honesty" and "approval≥disapproval" threshold for
2016 without any "computer search" –
those were simply the first values that sprung to my mind as
a plausible "theory of nature." E.g, I as a typical(?) voter would disapprove
any candidate who couldn't outperform a coin-toss in terms of honesty.
In a simplistic 1-dimensional model where a president, each time he
makes a decision based on a false fact, moves his country 1 step "backward"
but if based on a true fact moves it "forward"...
we see that by approving presidents who outperform
coin tosses, we are precisely approving the ones who
"tend to move the country forward."
But when I then attempted to redo that same test for USA 2012, it was inapplicable
because nobody achieved ≥51% honesty! Therefore I, putting on
my "typical(?) voter" hat once again, said to myself, said I, "in that case,
let's just lower our standards to: the top two most honest candidates in the race."
(I was somewhat biased in my choice of "two" since
I knew exactly two candidates tend to get the lion's share of the votes in
US presidential elections; plus in USA 2016, exactly two candidates were
involved in both "magic pairs.")
Then, after a considerable delay unsuccessfully seeking help from
some Frenchmen, I found out how to obtain Veritometre data for the France 2012 election.
But then again my initial test was inapplicable because all the 6 candidates
I had data on achieved ≥51% honesty!
Therefore I, putting on
my "typical(?) voter" hat a final time, said to myself, "in that case,
let's just raise our approval-threshold to: the top two most honest candidates in the race."
Note how I'm trying to keep my "theory of nature" the same for all three elections.
In the France 2012 case, however, the theory↔facts match, unfortunately for me,
no longer was arguably perfect. But there still was a partial match.
Then I finally was able to obtain a reasonable tranche of data for USA 2008,
and again the theory↔facts match was only partial.
The point of all the above was to reconstruct my thought process (which I assure you
was not at all deep) in writing. And now that I have done so, we know what "N" is so
that we can apply Bonferroni corrections. If for safety we intentionally choose the
least-confidence among the two or three listed tests for each election,
then no correction is needed at all,
and the confidence we get should be a safe lower bound.
If we choose the highest, however, then it should again be safe provided we
use Bonferroni with N=3 for USA 2012, and N=2 for USA 2016. (For France 2012
I never computed any precise confidence, but merely claimed that overall the French data
supported the Hypothesis more than it opposed it.)
Using USA 2016 & 2012 alone,
99.8% and 99% confidence using N=2 and N=3 corrections to each (i.e. 99.5% and 97%)
yield ≥99.97% in combination.
Here I am not using the naive p-multiplication combining formula "ba", but the more
valid and conservative formula (2b-a)a where b is the greater and a the lesser p-level.
(Alternatively, 99.5% and 88% confidence combine to yield
at least 99.9% confidence, but this is less good so I will not continue with it.)
Finally we can get an extra confidence boost
in either case by throwing in the French data too, which I believe
is enough to reach 99.98%.
I hope this satisfies my critic, and note 99.98% indeed
is not as great as 99.999%, i.e. his criticism did indeed accomplish
something useful in my [present revised] opinion.
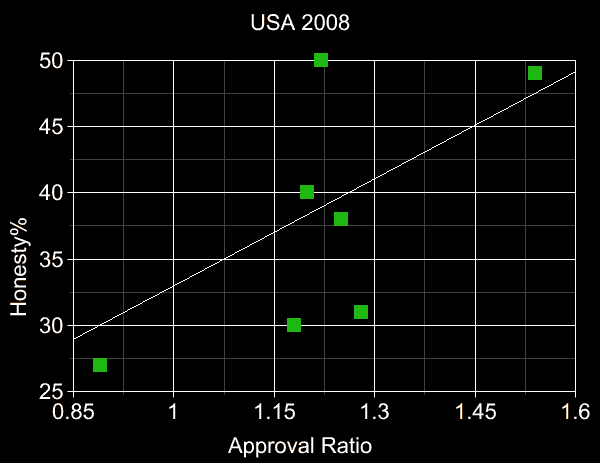
USA 2008 presidential election
The free-access online poll database
http://www.pollingreport.com
contains many approval-style (and some score-style) polls.
This, together with early politifact.com fact-checking data, enables
me to extend this study to include the USA 2008 election.
13/12 [CBS 15-20 Aug]; 27/22 [CNN/ORC 27-29 July RV]
Mitt Romney(R)
9 16 17 28 16 15
206
31; 1.28
41/32 [CNN/ORC 27-29 July]
Rudy Giuliani(R)
6 23 19 21 15 15
47
30; 1.18
46/39 [CNN/ORC 29-31 Aug RV]
Mike Huckabee(R)
10 12 29 22 7 20
41
27; 0.89
41/38 [Gallup Feb 8-10]; 24/34 [CBS/NYT 20-24 Feb]
Notes:
Warning: for candidates who also ran in other elections,
fact-checking data mixed in with facts
checked during later years.
Candidates tabulated only if FC≥20 and I have a 2008 approval poll for them.
For example Dennis Kucinich is excluded since even though he satisfies
the first criterion with FC=25≥20,
http://www.pollingreport.com/k.htm#Kucinich
has no 2008 approval poll for him.
Similarly we exclude Ron Paul since there is no 2008 approval poll
among those listed by
http://www.pollingreport.com/p.htm#Paul.
All the other candidates had ≤17 checked facts each.
Ron Paul was approval-polled by Economist/YouGov polls of 22-24 July, 4-6 Aug, and 11-13 Aug 2008
(and possibly more) but unfortunately their polling reports only stated one approval
number (which was 302 approvals out of 891 "valid cases" in July, 303 of 978 in early Aug, 284 out of 954 in mid-Aug)
despite their question wording
"Do you have a favorable or an unfavorable opinion of ..." soliciting two possible answers,
plus a probable, albeit unsolicited, "don't know" answer.
Generally we report only the most-recent approval polls we have, prior
to the Nov. 2008 election date. However,
Biden dropped out of the Presidential race on 3 January 2008,
but on 23 August became Obama's (vice presidential) running mate.
To avoid Biden's approval being conflated with Obama's,
we only use his approval polls before 23 August.
"RV" means that poll was among registered voters only.
CBS=Columbia Broadcasting System.
CNN=Cable News Network.
NYT=New York Times.
ORC=Opinion Research Center.
"Summary" column of table gives honesty (true + mostly true percentage);
and approval/disapproval numerical ratio.
Our Hypothesis would have predicted that H.Clinton and Obama,
as the two most-truthful candidates with 50% and 49% honesty (true + mostly true)
percentages respectively, ought to be the two most-approved.
In fact, Obama was the most-approved, but Romney, not Clinton,
was the second-most approved.
This could be regarded as a partial success.
A maximum likelihood model, and yet another criticism (by Gary Smith)
It is not sensible to test a theory with the same data that
were ransacked to concoct the theory.
If a theory was made up to fit the data, of course the data
support the theory! Theories should be tested with new data
not contaminated by data grubbing.
I'm afraid I must plead guilty to this criticism.
Referring
to my description of my thought process "concocting the theory"
last section, we could argue my original theory was developed
without reference to any data,
but the fact is, this whole investigation was stimulated by seeing,
ten seconds later, that it worked perfectly for the USA 2016 election.
If it had not, I probably would have never started this whole project, or
perhaps I'd have tried to devise a new theory.
Then, when it turned out the original theory
was inapplicable to the USA 2012 and France 2012 elections, I modified it a bit,
although as it turned out, just one common modification was used for both.
Finally, I did indeed test the theory in Gary-Smith-approved style
without any modification, on the USA 2008 election.
In some situations, e.g. if I were trying to invent the "ideal gas law" during
the era 1600-1850,
it would be no problem, after concocting the theory, to test it on new
gas samples. However, the present case is quite different because I
may have used up 100% of the (truthfulness, approval) election data
available to me in the world.
It is difficult to get more!
(Also, political data is inherently "messier" than gas-measurement data
since definitional questions arise.)
Plenty of other statistics books pay no attention to Gary Smith's Dictum.
They instead advise something like this:
Concoct a parameterized class of statistical models.
Using all the data you can obtain, construct the "likelihood function"
telling you the probability that data would have occurred given any particular model.
Find the "maximum likelihood" model in your class.
And in fact, I agree with those other statistics books to some degree, i.e.
do not 100% agree with that Gary Smith quote. Why? Even if your theory
is devised entirely by data-grubbing, with no independent ungrubbed data
at all available for testing, then a theory that works well enough plainly must
be given credence. For example if a coin, tossed 20 times, came up "heads" every time,
we suspect even Gary Smith would suspect the coin was biased, even if
he devised that theory after seeing that data.
In any case, let's carry out that procedure – which Gary Smith may not like, but at
the very least it will give us more understanding and more clarity about
exactly what our "hypothesis" is.
Here is my 1-parameter class of generative models:
There are C≥2 candidates in some particular election.
The input to the model is the honesty percentage for each candidate.
We then sample (without replacement)
two candidates from the C. The probability of choosing a candidate
is p if that candidate is among the two most-honest, and q otherwise,
where 0≤p≤½, 0≤q≤1/C, and 2p+(C-2)q=1.
(Our model has exactly one parameter, namely p.)
Those two candidates are predicted to be the two with the greatest approval/disapproval
ratios.
If p=q=1/C in each election,
then that model is just the uniform sampling model, i.e, the "null hypothesis."
We presume/hope, however, that some p>q will deliver greater likelihood, i.e.
a candidate by being one of the top two most honest, tends to enjoy more approval.
The combined likelihood formula (got by multiplying the individual likelihoods
under the naive assumption the four elections are independent)
is maximized over the domain 0≤p≤½ when
p≈0.4003 yielding Likelihood≈0.00667324≈1589.2×NHL
where NHL=1/2381400 is the likelihood of the null hypothesis.
So according to this calculation, our maximum likelihood model is 1589.2 times
more likely than the null hypothesis, corresponding to confidence≈99.937%
versus it.
But my first critic presumably would denounce this whole
process as "p-hacking" while Gary Smith would call it "data grubbing."
I believe both my critics here do have a point. I believe I had answered the first critic,
in the preceding section.
However, the question is what to do about Gary Smith's related
complaint. If we approximated the situation as "50% of
our theory was 'concocted via data grubbing' while the other 50% was tested on
new data" then perhaps our p-level should be squarerooted
in which case the "99.937% confidence" would shrink to 97.5%.
If 2/3 of the theory were concocted, then taking the cuberoot
presumably would be wanted (91.4% confidence) or if 3/4 then the 4th root (84.5%).
At this point I'm feeling somewhat statistically-battered, and
it evidently is not so easy to do statistics well under these circumstances.
But whichever way we do it, the confidences always come out high enough that
it still seems probable that there is some validity to all this.
Final Conclusion
So what is a valid conclusion, taking advantage of the information
obtainable through likelihood maximization using all 4 elections worth of data
– but immune to the criticisms?
Let me now try to state one.
The final (?) theory, in a formulation that seems obnoxiously specific
considering its crudity, is:
Hypothesis:
"If we associate probability 0.4 with each of the
two most-honest candidates, with the remaining 0.2 probability
equidistributed among the remaining candidates
(everything restricted to candidates important enough to have
substantial fact-checking done on them and for pollsters to determine
their approval) then:
the two most-approved candidates are predicted to be
got by sampling two candidates from that non-uniform distribution without replacement."
We now deduce a final confidence as follows. This hypothesis arose
by finding the max-likelihood model within a 1-parameter class of models.
The parameter was called "p."
Its likelihoods range everywhere from zero (when p=0 or p=0.5) up to
the maximum attained when p≈0.4003.
If we had tried every p in
the 7-element equispaced finite set {0.04, 0.11, 0.18, 0.25, 0.32, 0.39, 0.46}
then the top two most-likely models would have been with p=0.46 and p=0.39
which are respectively 815 and 1571 times more likely than the null
hypothesis.
It then seems valid to apply a Bonferroni correction
with N=7 to deduce a valid confidence>1-7/1571≈99.55% lower bound.
If we had instead employed
the 8-element equispaced finite set {0.01, 0.08, 0.15, 0.22, 0.29, 0.36, 0.43, 0.5}
then the top two most-likely models would have been with p=0.43 and p=0.36,
which are respectively 1406 and 1363 times more likely than the null
hypothesis. Even the worse among these two (p=0.36)
with a Bonferroni N=8 correction
would yield a valid confidence>1-8/1363≈99.41% lower bound.
In view of both the fact that Bonferroni is often overprotection,
and the fact the true max-likelihood parameter choice p=0.4003 ought to be better
than either 0.36 or 0.39, the true confidence
is greater than these lower bounds; and furthermore our model obviously is
crude, so presumably there is some better and truer (but unknown) model
of the truth↔approval connection which would enjoy greater confidence still.
It also is worth noting that in all four of the elections we've
examined, the two top finishers with the official voting system,
were never the same pair as either the two most-approved
or the two most-honest among the candidates we considered:
Election
#canddts
Top 2 officially
Top two approval
Top two most-honest
USA 2016
21
H.Clinton & Trump
Sanders & Kasich
Kasich & Sanders
USA 2012
9
Obama & Romney
Ron Paul & Obama
Obama & Ron Paul
France 2012
6
Hollande & Sarkozy
Hollande & Bayrou
Melenchon & Hollande
USA 2008
7
Obama & McCain
Obama & Romney
H.Clinton & Obama
In other words, approval voting is genuinely different
than the official USA & French systems. And it's probably better, since in
USA 2016 and USA 2012, Approval chose the top 2 most honest candidates both times,
while Official got 0 and 1 respectively;
while in France 2012 and USA 2008, Approval and Official each got 1.
Regarding the latter two races: Bayrou overall seems
to have been slightly more honest than Sarkozy,
indicating Approval was a slightly better voting system,
although each beat the other on one of the two Veritometre honesty scores.
Which of {McCain, Romney} was more honest depends
how one determines that, e.g. McCain had greater H4 and H5 indicating
McCain was more honest (and H4+H5 had been my main honesty measure
for USA 2016 and USA 2012), but H3+H4+H5=59
was greater for Romney than McCain's 57, indicating Romney was more honest –
so in that sense their honesties are not comparable.
(Despite this I still would overall regard McCain as the more honest.)
In that same sense Sanders & Clinton
had noncomparable honesties in USA 2016, but both dominated Trump at every
politifact honesty level. In USA 2012, Obama dominated Pawlenty,
who in turn dominated Ron Paul, who in turn dominated everybody else
except for being noncomparable with Huntsman and Romney
(and despite that I still would regard Paul as overall more honest than either).
As the bottom line, Approval seems better than the Official systems based on
honesty data from all 4 elections,
but about the same based on the earliest two alone.
In all of these 4 elections, both the official and
approval winner were "effectively most honest" candidates in the sense that the
true max-honesty candidate was less than one statistical
standard deviation error (assuming checked facts are chosen randomly from a much larger
fact-pool for each candidate)
above Politfact's estimate
of the official- and approval-winners' honesty percentages.
We could summarize that as "this is evidence that Democracy works!"
But we warn the reader that actually, fact-checkers do not
choose which facts to check by random selection from a large pool –
they instead concentrate on particularly prominent, interesting and/or
unclear ones –
and even a single Big Lie can (and probably should) cause many voters
not to vote for a candidate.
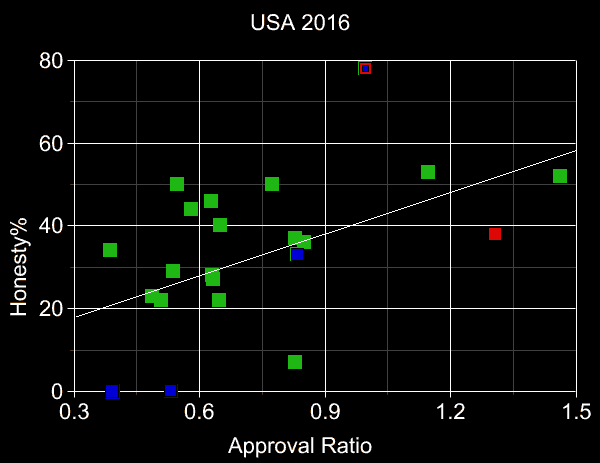
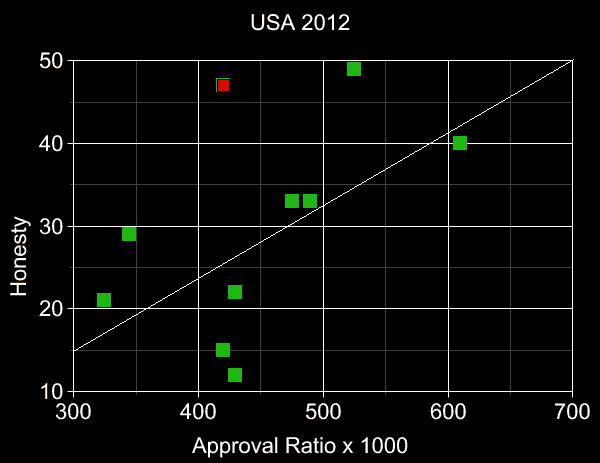
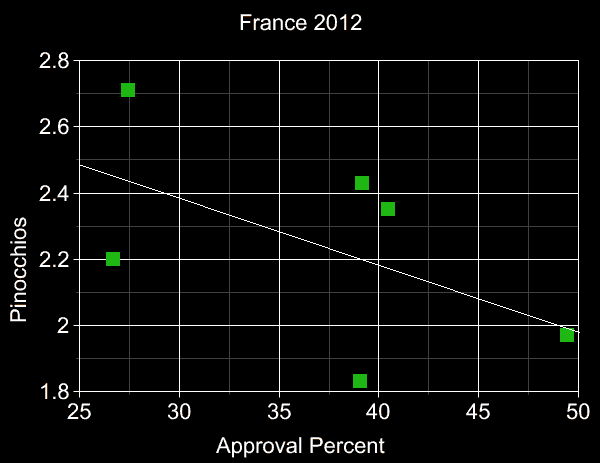
The plots below present our data tables in graphical form. Blue points are low-data candidates
(<10 checked facts) and red ones are "candidates" who either never actually ran, or dropped out
well before the first vote was cast. All other candidates represented by green points.
Least-squares
regression
lines also shown (with the red Pawlenty point omitted from
the USA 2012 fit),
demonstrating that greater honesty and greater approval
tend to correlate, for all candidates, not merely the ones
obtaining the highest approval.
Note that in all 4 cases the line's slope has the "correct" sign
(and this remains true whether or not we include red and/or blue points in the linefits),
which alone is an event of
probability=2-4=1/16=6.25% under the null hypothesis.
Implications for Democracy
The important book
Democracy for Realists
by C.H.Achen and L.M.Bartels
(Princeton Univ. Press 2016) begins
In the conventional view, democracy begins with the voters.
Ordinary people have preferences about what their government should do.
They choose leaders who will do those things, or they enact their
preferences directly in referendums. In either case, what the majority
wants becomes government policy – a highly attractive prospect...
That way of thinking about democracy...
constitutes a kind of "folk theory" of democracy, a set of accessible,
appealing ideas assuring people that they live under an ethically
defensible form of government that has their interests at heart.
Unfortunately, while the folk theory of democracy has flourished as an ideal,
its credibility has been severely undercut by a growing body of scientific
evidence presenting a different and considerably darker view of democratic politics...
the great majority of citizens pay little attention to politics. At election time,
they are swayed by how they feel about "the nature of the times," especially
the current state of the economy, and by political loyalties typically
acquired in childhood. Those loyalties, not the facts of political life and
government policy, are the primary drivers of political behavior.
Election outcomes turn out to be largely random events from the
viewpoint of contemporary democratic theory. That is, elections are well
determined by powerful forces, but those forces are not the ones that
current theories of democracy believe should determine how elections come out.
Hence the old frameworks will no longer do.
We want to persuade the reader to think about democracy in a fundamentally different way...
the mental framework they bring to democratic life, while it may once have seemed
defensible, can now be maintained only by willful denial of a great deal of
credible evidence. However disheartening the task, intellectual honesty
requires all of us to grapple with the corrosive implications of that
evidence for our understanding of democracy. That is what this book aims to do.
Unfortunately, Achen & Bartels' book tells us very little about what to do
to improve this "disheartening" and "unfortunate" state of affairs.
Their book does not even mention, much less consider the effect of,
improved forms of voting like
approval,
score,
or even Borda, Condorcet systems, instant runoff, or
proportional representation.
However, the picture suggested by
our data here differs from the gloomy one painted by Achen & Bartels.
With approval voting, the voters work in a largely fact-based manner
to determine and elect the candidates (from a wide democratic marketplace, not just two)
who are the most honest – or they somehow accomplish something equivalent to that
despite working in some different manner. And if by "random events" Achen & Bartels meant
what we have been calling "the null hypothesis" then we have refuted this claim
(with whatever confidence the reader chooses to believe we attained –
we contend >99.5%),
for approval voting based democracy.
This suggests that there is a very simple very easy cure for the ills of
democracy pointed out by Achen & Bartels – just switch to approval
(or, probably even better, score) voting – and that the underlying cause of
the disease was our ultra-poor plurality voting system.
Furthermore, some of the symptoms A&B point out, such as
"political [party] loyalties typically
acquired in childhood" (also on p.26 they complain about artificial "unidimensionality")
are caused by the fact the USA has a 2-party domination,
which probably is the result of its foolish use of plurality voting.
(E.g. Score and approval voting were used in Ancient Sparta
and renaissance Venice both for longer than the entire history of the USA,
with no record of political 2-party dominance
ever developing.) And the lack of voter knowledge A&B complain
about may have something to do with the
lack of media coverage, which in turn is
caused by the plurality voting system. Specifically, right now
(mid-September 2016), few Americans know anything
much about Gary Johnson, even though he, if reckoned by approval/disapproval ratio,
is the clear frontrunner in the USA presidential race.
(38% of Americans do not even recognize Johnson's name, according to a Huffpost/YouGov
survey
25-26 August 2016.)
Why do few Americans know about Johnson? Because the media has
told them almost nothing about him. Why has the media said almost nothing about him?
Because the USA is using plurality voting, not approval voting, so that
the fact Johnson is the leader with the latter system, implies virtually nothing
about his chances of winning the presidency, and indeed Johnson's
chances are near zero – therefore media has no motivation to cover him.
Why are Johnson's chances near zero? Because
with plurality voting any vote for anybody who is not one of the two leaders,
is "wasted." Few are willing to waste their vote, causing Johnson to get few votes
(tremendously fewer than he "deserves" in view of his approval), causing his chances
to be near zero, in a self-reinforcing cycle.
This Johnson discrepancy also makes it completely clear that USA
democracy, because of the voting system,
does not elect the candidates voters (tell pollsters they) regard as best.
The same effect, over historical time, has
caused only two parties to
dominate
US politics totally, even though their current presidential candidates are the
two most-disapproved major party nominees in the entire history of approval-style polling
(dating back to 1956 using Gallup data, and dating back to 1980 using CBS/New York Times
poll data; the closest competitor in terms of low approval was Barry Goldwater in 1964)
and even though the US congress as a
whole – almost entirely occupied by the Democratic and Republican parties –
is
currently
only 18% approved. This in turn has caused the development of fairly mindless
"party loyalties" because under such circumstances it is pointless to be a free-thinker.