Data and many words from OpenSecrets.org. Edits & additions by Warren D. Smith Feb. 2014. Idea of contrasting House vs. Senate rates to assess gerrymandering by Edward Earl.
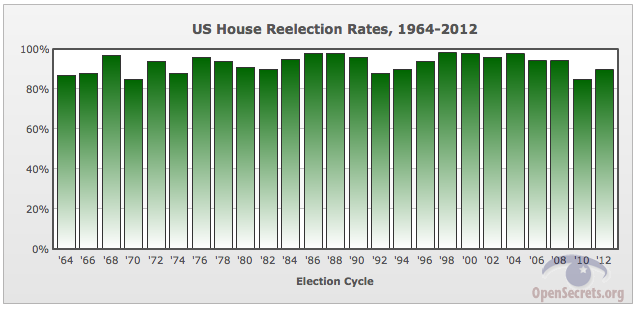
Few things in life are more predictable than the chances of an incumbent member of the U.S. House of Representatives winning reelection. With wide name recognition, and usually an insurmountable advantage in campaign cash, and heavy gerrymandering, House incumbents typically have little trouble holding onto their seats—as this chart shows.
Senate races also overwhelmingly favor the incumbent, but not by as reliable a margin as House races. Big swings in the national mood can sometimes topple long time office-holders, as happened with the Reagan revolution in 1980. Even so, years like that are an exception:
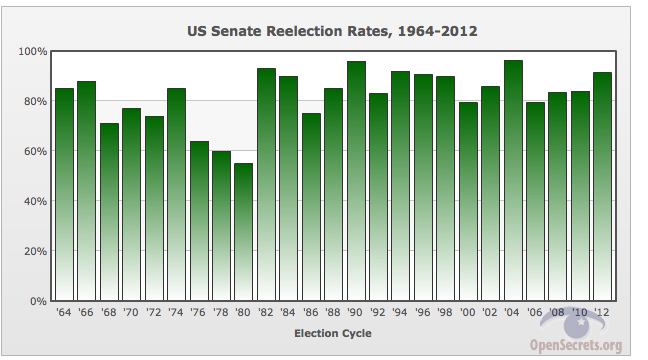
US Senate seats cannot be gerrymandered because the entire state votes on each senate race. House seats can be (and as of 2013 unfortunately usually are) gerrymandered by drawing the district lines. Those facts allow us to assess the impact of gerrymandering. [We have made no attempt to verify the OpenSecrets.org data, we simply used it and hoped that if it had any errors they had little or no impact on our House vs. Senate comparison purpose.] As you can see, the House re-elect rates equalled or exceeded the Senate rates all 25 years plotted except 1982. If gerrymandering had no impact, then you'd expect the question of which rate would be greater to be a coin toss, and if anything would expect the House reelection rates to be lower because House districts have smaller populations and hence greater random variability (percentagewise). But in fact, the data is hugely inconsistent with the "fair coin toss" hypothesis (at the 25·2-25=0.000000745 or, more conservatively, 25·2-24=0.00000149 probability level ) and is even more inconsistent with the "House rates lower" refinement of that hypothesis.
So yes. Gerrymandering seems clearly real. A suggested cure for gerrymandering is the shortest splitline algorithm.