Puzzle
The Wall Street Journal
(4 March 2008) published an op-ed by Nansen G. Saleri "debunking the myth" of "peak oil."
Other "debunkers" have also appeared. The essence of their argument is this. Some oil
is findable and economic to extract. Some isn't.
(E.g. if it costs more energy to extract some oil than you get by burning it, it
is safe to say that oil is of no economic interest.) With better technology, more is.
There is no way to predict future technology and future discoveries,
therefore all claims to predict the future of
oil production are bunk.
Try to debunk the debunkers: Find a very simple and very conservative model of future technology and economic change. Two versions of M.King Hubbbert's extremely successful methodology for predicting "peak oil" (which worked highly successfully for Texas, Pennsylvania, and US-wide oil production; applied instead to the whole world it predicts the peak oil year will be between 2010 and 2020) are:
where Q,K,R,A,B,C are constants with K,Q,B,R positive, chosen to best-fit the historical data. [Actually, the second model improves over, i.e. generalizes, what Hubbert did.] Note the Gaussian is symmetric, but the GLHC curve is (in general) unsymmetric, about the peak. This addresses another criticism raised by Saleri, i.e. that the peak might be unsymmetric.
Finally, perform a fit to oil-production data and predict the peak-oil year. I believe you will discover that your predictions have a very large error bar. However if one also incorporates estimates of world oil reserves into the mix, the error bar shrinks a lot.
By Warren D. Smith Oct 2009.
D. Consider a huge number N of "pebbles." You can at any time turn over a pebble. If the other side of the pebble has oil, you grab the oil. From then on, anybody turning over that same pebble, will not find oil. If, each timestep, a random pebble is chosen and turned over, then the probability timestep t will reveal oil, declines exponentially for large t. That is a simple model explaining why the large-t asymptotic plausibly ought to decline exponentially. The far-past-t asymptotic also ought to be exponential, but for a different reason: economics. The first person to discover/exploit technology for turning pebbles over, will get rich. The increase-rate of their wealth will be proportional to their current number of oil rigs (i.e. to their current wealth, i.e. to their oil-extraction rate), i.e. their wealth w(t) obeys w'∝w, and the solution of this differential equation is exponential growth. In general these two (initial-growth and far-future-decline) exponentials will not have the same rate-constants, which explains why the GLHC is (and why it should be) unsymmetric.
C. Peak production in the Gaussian model obviously occurs when t=tpeak. In the "generalized logistic Hubbert" model (GLHC) we find by solving (d/dt)production(t)=0 for t, that the maximum occurs when t=ln(AB/[2C-A])/C.
B.
The total oil production in the Gaussian model is
This expression is well defined if C/A>1/2 except when C=A; then one
must use its limiting value when A→C, namely (according to L'Hopital's rule)
Chebyshev (further) actually proved that∫xU(A+BxV)Wdx = xU+1A-W/(U+1) · 2F1((U+1)/V, W; (U+1)/V+1; -BxV/A) is integrable in terms of "elementary" functions if and only if either (U+1)/V, W, or their sum is an integer. Our case qualifies since W=-2. (In those "nice" cases the 2F1 simplifies to be expressible in terms of more-elementary functions.) This theorem and history is from J.F.Ritt: Integration in Finite Terms: Liouville's Theory of Elementary Methods, Columbia University Press, New York 1948 (see pp.37-39); and E.A.Marchisotto & G-A.Zakeri: An Invitation to Integration in Finite Terms, The College Mathematics Journal 25,4 (Sept.1994) 295-308. (This is yet another example of Maple failing to do an integral which it was known over 100 years ago can be done – despite oft-heard claims that Maple's indefinite integration algorithm is all-powerful.) This integral from x=0 to ∞ isV-1AW(A/B)(U+1)/VΓ([U+1]/V)Γ(-W-[U+1]/V)/Γ(-W) [see Gradshteyn & Rhyzhik: Table of integrals, series, and products, Academic Press 5th ed 1994, eq 3.241.4 and require AB≠0 and 0<(U+1)/V<-W]. Our special case W=-2 simplifies (G&R eq 3.241.5) thanks to a Gamma-function reflection formula allowing us to get rid of the Gamma functions and replace them with a sine.
A. Assume that thanks to technology improvements, ability to find and recover oil grows exponentially with time, meaning (more precisely) the probability some ultimately-extractible (with best-possible technology) oil molecule can escape harvesting drops exponentially with time. The most famous example of exponential growth thanks to technology was "Moore's law" in microelectronics. This law worked quite well for a long time but is now ending. On a finite planet made of finite-size atoms, exponential growth cannot keep going exponentially. That is why I am saying this model is "very conservative"; even a technology which did keep growing exponentially forever still would not hurt our model's validity.
Anyhow, here's my point. If the production versus time curve would have been Gaussian in shape with fixed technology, it still will be with exponentially-improving technology, since a Gaussian times an exponential, is still a Gaussian. Also, multiplying a GLHC curve by an exponential function of time still yields a GLHC (perhaps with different parameter values). Ditto for exponential economic growth of demand, of oil-company size, etc. All these things leave Gaussianity (or GLHCness) exactly unaffected. Hence they leave the Hubbert peak-finding technique exactly as valid as it used to be.
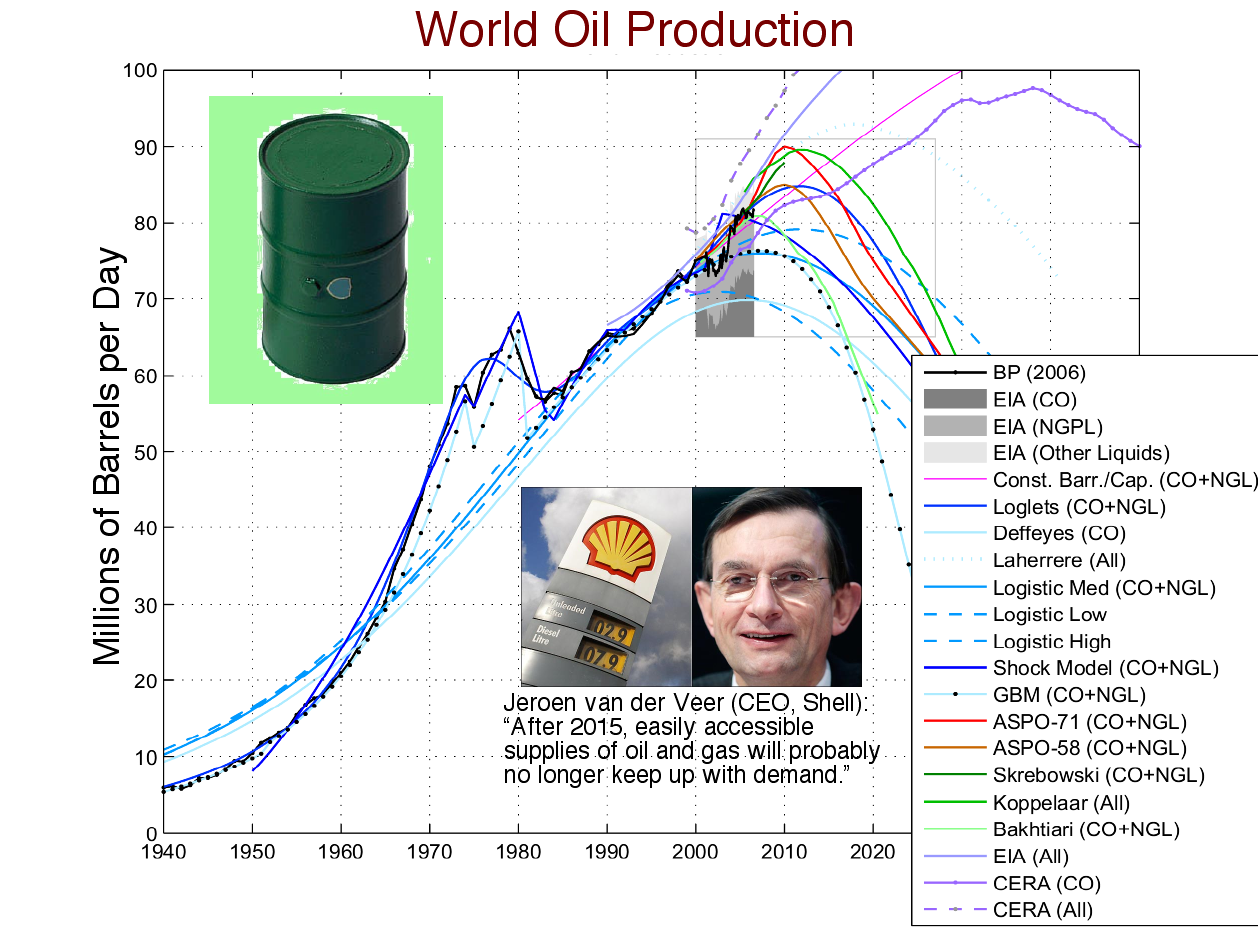
It is false to claim that technology improvement is unpredictable or that the Hubbert peak is "debunked" or unpredictable. Indeed, many oil-industry and government groups have performed predictions and there is heavy agreement the peak will be between 2010 and 2020, probably before 2015, see figure below based on data up to 2007.
Seeing no reason to trust the work of others, I tried my own data fit. My conclusions were quite different than most of the others!
World oil production estimates 1960-2008 are here. Also for 1950-1964 the US dept of energy and US dept of defense gave this time series: 10.42, 11.73, 12.34, 13.15, 13.74, 15.41, 16.78, 17.64, 18.10, 19.54, 21.03, 22.43, 24.33, 26.13, 28.25 which overlaps with the other dataset during 1960-1964 and agrees with it to within ±0.07 each of these 5 years.
In total, then, the dataset I used for fitting was (for the 60 years 1950-2009, with the 2009 figure only being a forecast based on data partway through 2009)
10.42, 11.73, 12.34, 13.15, 13.74,   15.41, 16.78, 17.64, 18.10, 19.54,
21.01, 22.44, 24.34, 26.13, 28.215,  30.33, 32.96, 35.39, 38.63, 41.70,
45.89, 48.52, 51.14, 55.68, 55.72,   52.83, 57.34, 59.71, 60.16, 62.67,
59.56, 56.05, 53.45, 53.26, 54.50,   53.97, 56.20, 56.63, 58.69, 59.79,
60.49, 60.19, 60.12, 60.17, 61.10,   62.38, 63.75, 65.74, 66.97, 65.92,
68.49, 68.10, 67.16, 69.43, 72.49,   73.74, 73.46, 73.01, 73.78, 71
[The units are millions of barrels per day.] The best two fits I found (using t=year-2000) were
both of which achieved sum-of-squared-errors=926.1, i.e. annual RMS error=3.9 million barrels per day. The former has production peak in 2079 and total oil ever produced=1.8×10¹⁶ barrels. The latter has production peak in 2076 and total oil ever produced=1.4×10¹⁶ barrels. The total oil produced during 1950-2009, in contrast, was 1.06×10¹² barrels, indicating that these fits are clearly ridiculous! (A "barrel" is 158.987295 liters.)
The moral is that the GLHC fitting problem is "numerically ill-posed." That is, you just cannot get reliable answers out by finding the best GLHC fit to the data in! There is an inherent reason for that: there is an exponential growth phase (pre-peak), and an exponential-decline phase (post-peak). It is very numerically difficult to try to deduce the constant governing the decline phase, from the mostly-pre-peak data (it is best for this purpose to consider the reciprocated production data) all of which lies in the noise-polluted "thin" part of its exponential. It is easy to understand the exponential growth phase because the data covers the "fat" part of that exponential – but we need both. What is of somewhat more interest than just the single best (least sum-of-squared-errors) fit, is the ensemble of all GLHC curves with sum-of-squared-errors<1030. I generated and examined (what I think approximately are) 400 random elements of this ensemble.
Based on these 400, the 99%-confidence interval for the peak-production-year is [2005.7, 2052.5]. That is, ≥99% of the time you choose a random curve from this ensemble, its peak-location lies within that interval. (Interestingly, the best fits ever found, given above, actually lie outside that interval – highly skewed statistics!) A 90% confidence interval is [2007, 2037]. The 99%-confidence interval for the total oil ever produced is [1.4×10¹³, 1.5×10¹⁵] barrels. The reason for the enormous high-end is that there is some small-probability-mass region of the ensemble whose future-exponential-decline involves a very slow decline, leading to enormous total production. Indeed in the limit of very slow decline the total production would be infinite. That singularity is the source of the "skewedness" of the statistics.
These (rather wide!) confidence intervals quantify exactly how reliable these predictions are, i.e. much less reliable than the claims of previous Hubbertians made it sound! For example K.S.Deffeyes in his book Beyond oil, the view from Hubbert's peak, Hill & Wang updated ed. 2006, claimed "by my reckoning, world oil production passed its peak on 16 December 2005... [although perhaps it was] 17 December." This hubristic statement was, of course, absolutely ludicrous.
The technique we have used has the advantage of being immune to errors (and intentional lies – which seem large and numerous!) about the estimated size of oil deposits. However, it has the disadvantage of yielding large "error bars" in our predictions. World oil reserve estimates provided by the top 17 oil countries are tabulated below.
| Country | Reserves | Production | Reserve life | ||
|---|---|---|---|---|---|
| 109 bbl | (km)3 | 106 bbl/d | 103 m3/d | years | |
| Saudi Arabia | 267 | 42.4 | 10.2 | 1,620 | 72 |
| Canada | 179 | 28.5 | 3.3 | 520 | 149 |
| Iran | 138 | 21.9 | 4.0 | 640 | 95 |
| Iraq | 115 | 18.3 | 2.1 | 330 | 150 |
| Kuwait | 104 | 16.5 | 2.6 | 410 | 110 |
| United Arab Emirates | 98 | 15.6 | 2.9 | 460 | 93 |
| Venezuela | 87 | 13.8 | 2.7 | 430 | 88 |
| Russia | 60 | 9.5 | 9.9 | 1,570 | 17 |
| Libya | 41 | 6.5 | 1.7 | 270 | 66 |
| Nigeria | 36 | 5.7 | 2.4 | 380 | 41 |
| Kazakhstan | 30 | 4.8 | 1.4 | 220 | 59 |
| United States | 21 | 3.3 | 7.5 | 1,190 | 8 |
| China | 16 | 2.5 | 3.9 | 620 | 11 |
| Qatar | 15 | 2.4 | 0.9 | 140 | 46 |
| Algeria | 12 | 1.9 | 2.2 | 350 | 15 |
| Brazil | 12 | 1.9 | 2.3 | 370 | 14 |
| Mexico | 12 | 1.9 | 3.5 | 560 | 9 |
| Total of top seventeen reserves | 1,243 | 197.6 | 63.5 | 10,100 | 54 |
| Notes: Reserve to Production ratio (in years), calculated as reserves / annual production. | |||||
The above reserve estimates are for "crude" and do not include "oil shale" of which (it has been estimated by the World Energy Council) the total worldwide recoverable reserves are<3.3×10¹² barrels.
It is generally believed that lies about reserves are mostly overestimates. We can combine this data with our fit-ensemble technique above by considering only those elements of the error-square-sum<1030 ensemble which have total-oil-extraction<1.3×10¹³ barrels (i.e. ten times the claimed estimates from the top 17 oil countries). Even using presumably-quite-weak upper bounds such as this has a large effect on our statistics because it "slices off" the infinite-oil-singularity. After finding 400 elements of this sub-ensemble, I find with 99% confidence that the production peak lies in [2005, 2009]. If we instead use 4.6×10¹³ barrels as the upper bound (i.e. ten times the total estimated worldwide crude and recoverable shale-oil reserves) then based on 400 elements of that sub-ensemble I find with 99% confidence that the production peak lies in [2006, 2021] and with 90% confidence that it lies in [2008, 2017].
These estimates are more in line with those of previous Hubbertians.