By Warren D. Smith, January 2007
Ka-Ping Yee in 2006 introduced a wonderful way to examine single-winner election methods via computer graphics. Versions 2.0 and above of my program IEVS (Infinitely Extendible Voting Simulator; see example input) support generation of Yee-type pictures and the pictures in this directory were produced by using IEVS.
To explain how Yee pictures work: imagine the N "candidates" are N fixed points in the Euclidean plane. The voters also are points in that plane, but imagine they are random points sampled from a 2-dimensional Gaussian distribution with prescribed variance and prescribed centerpoint (peak location) (x,y). Imagine these voters conduct an election to choose a winner. Voters prefer candidates that are nearer to them ("utility is a decreasing function of voter-candidate distance"). We then color the pixel at (x,y) with the color of the winner (selected from a fixed N-color palette). Do this for every (x,y) and the result is a multicolored picture. You get different pictures depending on the candidate-coordinates, the voting method used, and the variance of the Gaussian.
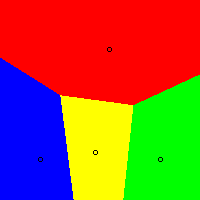
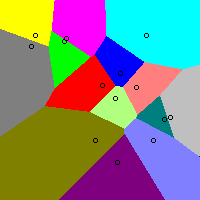
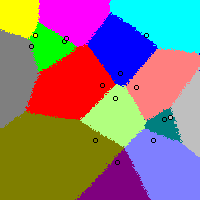
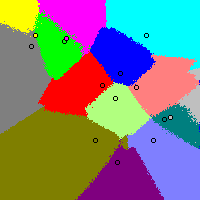
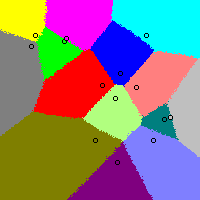
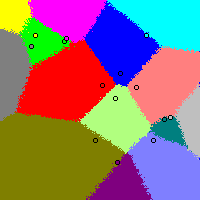
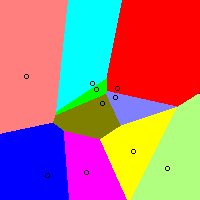
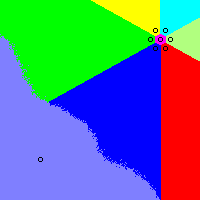
All election methods ever seriously proposed return the same Yee-picture (at left; the candidate-locations are indicated by the little circles)
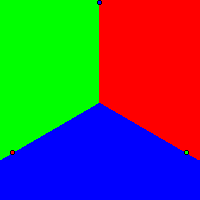
All those methods perform "optimally," i.e. elect the best winner for society always in this scenario. If they instead were to elect the worst winner, we'd instead get the picture at right.
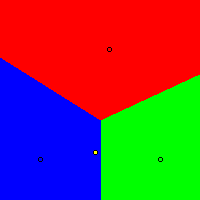
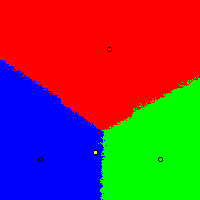
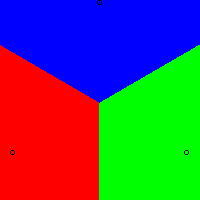
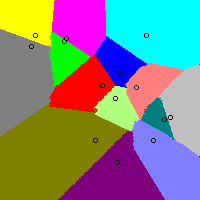
Almost all election methods ever seriously proposed return the same Yee-picture (at left):
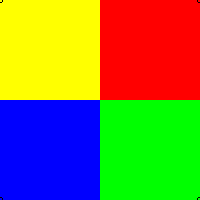
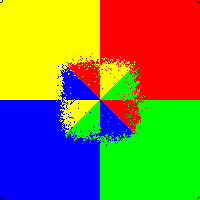
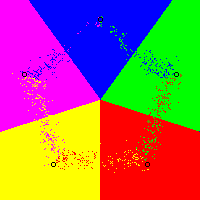
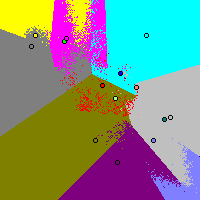
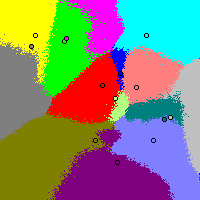
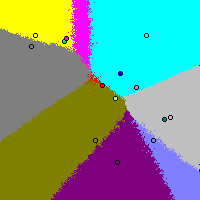
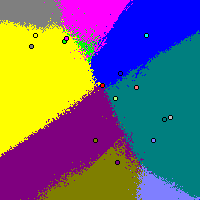
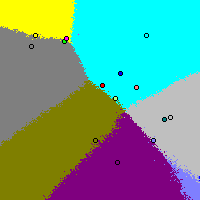
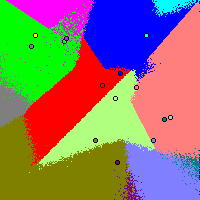
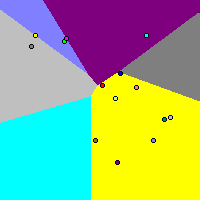
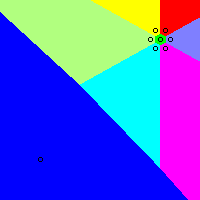
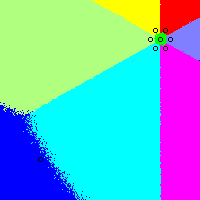
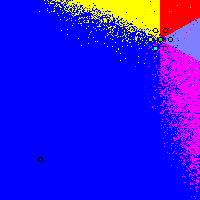
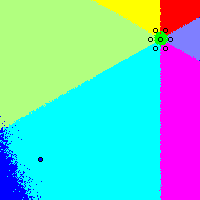
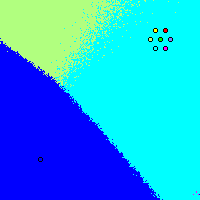
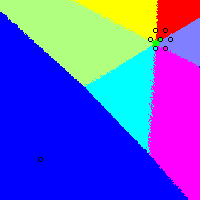
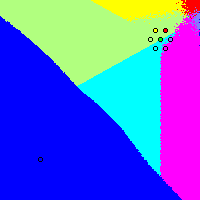
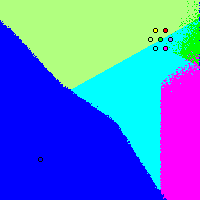
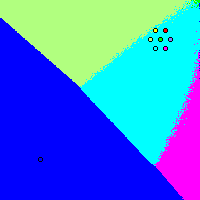
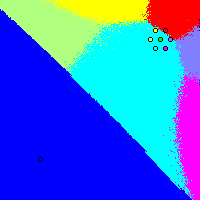
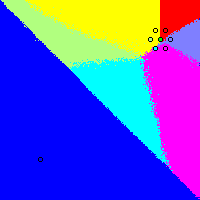
which again represents optimal performance. But not all: the IRV (instant runoff) method returns a rather different (and crazy) picture (using for the voter-Gaussian's σ=196 in each axis direction; the picture is 200x200), at middle. If we go to pentagonal rather than square symmetry (rightmost picture), then IRV behaves better – it always elects the optimal winner in the large #voters limit – but in some ways it behaves even more peculiarly: here there is a pentagonal ring of "tough to call" elections in which IRV (due to voter randomness) occasionally returns a suboptimal winner. The truly tough-call elections are near the center of the pentagon, but that is not the way IRV perceives it.
The points are: (120,126), (64,158), (102,114), (35,164), (66,161), (146,164), (153,59), (115,101), (136,112), (95,59), (117,37), (164,80), (31,153), (170,82). The picture window is [0,199]x[0,199] with the origin in the lower left corner. In all the pictures in this section the utility function is 1/√(12000+Distance²) and the Gaussian has σ=70 in each axis direction.
In the limit of a large number of voters, all of the following voting methods
The theorem that with honest voters distributed centrosymmetrically about any given pixel, and utility a decreasing function of voter-candidate distance, a Condorcet winner always exists and is the closest candidate to that pixel, apparently was first proved by [Otto A. Davis, Morris H. DeGroot, Melvin J. Hinich: Social Preference Orderings and Majority Rule, Econometrica 40,1 (Jan 1972) 147-157, see thms 1 and 4 and corollary 2]. It also was mentioned by [Richard D. McKelvey: Intransitivities in multidimensional voting methods and some implications for agenda control, J.Economic Theory 12 (1976) 472-482.]

The Brams-Sanver "preference approval voting" method (pictured middle above) empirically also exhibits optimal performance in this case (honest voters using mean candidate utility as approval threshhold). However one occasionally encounters 2D scenarios in which the Brams-Sanver picture and the Voronoi diagram do not completely coincide. [Example: Take σ=100 and three candidates at (60,60), (140,140), (60,160) or the last point can be replaced by (120,60); in both cases the picture will disagree slightly with the Voronoi diagram near (100,100).] And approval voting also does not coincide with the Voronoi diagram if voters use the strategy of approving candidates above mean utility and disapproving those below (2nd from right picture above); this method appears to give centrist candidates a big advantage and in this case obliterated 7 of the candidates (including 6 of 8 non-central "outsiders") down to zero win-region. (A 2X-zoomed out version of the same picture is at the far right.)
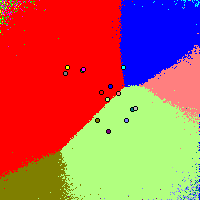
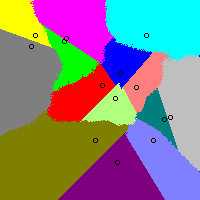
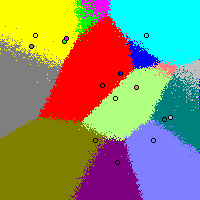
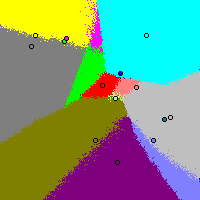
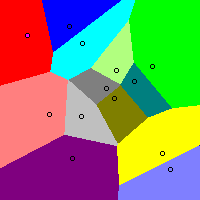
Meanwhile, IRV (honest voters, lefthand picture below) exhibits crazy behavior in which about half the candidates can never win, many others do not lie within their own win-regions, the win regions can exhibit crazy shapes (including severely-nonconvex, disconnected, and non-simply connected...), and there are a lot of "close call" (random dot) regions representing election "near-tie nightmares." Incidentally, IRV supporters have told me they believed it was rare for IRV to fail to elect a Condorcet winner (when one existed). They're wrong: every pixel in this picture where the IRV picture differs in color from the Voronoi pixel, is a counterexample. Observe that IRV gives "outsiders" or "extremists" a large advantage over "centrists." [Note: if we tell IEVS to use more voters, then the randomness in the pictures diminishes, but it costs a lot more computer time. In all these pictures, each pixel has TopYeeVoters=256 which, roughly, means that each pixel is based on votes from ≈2500 voters. I actually prefer to use this parameter setting as opposed to trying much harder to take the number of voters to ∞, because that way we can see the presence of "near-tie election nightmares" easily in the picture.]:
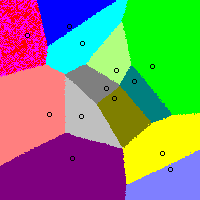
2nd from left above is honest Bucklin voting, which I suppose exhibits better behavior than IRV (since at least with Bucklin every candidate here can win), but which also has crazy, severely non-convex and non-starshaped win-region shapes (despite the fact Bucklin is a "monotonic" voting method), and which also exhibits win-regions (magenta at top and light grey at right) not containing their candidates. Second from right is Nauru voting, which seems for honest voters to improve over Plurality (right hand picture below). Rightmost is Coombs voting, which is the best-behaved of this series for honest voters (although a complete disaster for strategic voters).
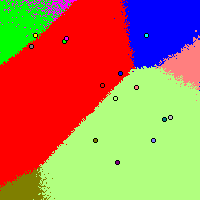
Here's a chain of related, but progressively less expressive and hence (for honest voters) worse, voting methods. We begin (lefthand picture below) with honest (but "rescaled" – each voter rescales utilities so her best choice is 99 and her worst is 0 before voting them) range voting. The picture is very similar to the Voronoi diagram, but slightly distorted; and note that the magenta candidate is outside its win-region. [If there were no rescaling, or if there were an additional candidate very far away (well outside the pictured area) then the distortion would have been zero and range voting would have yielded exactly the Voronoi diagram.] (Honest continuum cumulative voting yields a picture almost indistinguishable from range voting in this case.) Honest Borda voting is the 2nd from left picture below – it behaves similarly, but now the distortion is larger, and note that 4 candidates lie outside their win-regions and that some win-regions have slightly (but clearly) non-convex shapes. (Borda is less expressive than range voting since voters cannot express strength of preference.)
Honest Dabagh voting (picture 2nd from right above) is much less expressive than Borda since Dabagh voters can indicate only their first and second choices. On this candidate-set, Dabagh is a complete disaster. Note how, incredibly, it actually swaps the brown and purple regions – and the yellow and grey regions at the top left(?!) – versus the Voronoi diagram. Finally at the far right is plain plurality voting, which is the least expressive of all (voters can only indicate their top choice); it is in some ways even more of a disaster than Dabagh, obliterating all the centrist candidates down to zero-win-regions (and the light-blue candidate is not in its own win-region). Venzke's disqualified plurality voting method (which is supposed to improve on plain plurality) yields the exact same picture as regular plurality voting in this case.
Below are the four methods that (with range voting) are the best according IEVS's Bayesian regret measurements. From left to right, Range+top2-runoff, Approval(mean-based threshold)+top2-runoff, Brian Olson's IRNR system, and Chris Benham's MCA system. (Some of these don't look too good, so how can these methods be the "best"? Well, IEVS also takes account of a vast number of non-geometric scenarios. Just because methods do not perform terribly well in these Yee-type 2D geometric scenarios, does not necessarily prevent good performance in others.) Notice how the top-2-runoff between the top two range voting finishers tends to help correct for distortions caused by "normalization" effects in plain range voting. (It also tends to fix problems caused by "strategic voting," since even strategic voters will vote honestly in the runoff round, but that is not an issue here since these pictures involve honest voters.) Thus the range+top2runoff picture (left below) does look quite good, i.e. greatly resembles the optimum-winner (Voronoi diagram) picture. IRNR looks worse (e.g. several winners not in their own win-regions, some weird shapes) but still not too bad, albeit MCA and Approval+top2-runoff look pretty bad.
Below (left three) are two related voting methods based on eigenvector and Markov-chain ideas. In the middle is the Voronoi diagram again (for comparison) on the left is the Keener eigenvector system (which appears to behave very similarly to Range and Borda), and on the right is Sinkhorn. Note how Borda and Sinkhorn appear to favor the centrists (perhaps due to "teaming") in contrast to honest plurality voting (rightmost picture two-above) which kills them and favors the extremists (presumably as a result of "cloning" or "vote splitting," which are the opposite of teaming). On the far right (since we had to put it somewhere) is Woodall-DAC, which note refuses to permit the dark-blue and dark-green candidates to win anywhere.
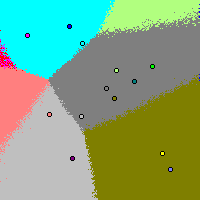
On the left below is Top median rating which is like range voting but based on median rating not average rating. Presumably because of the less-smooth functional dependence of median as opposed to average, top median rating exhibits some strange pathologies not suffered by range, as well as many more "near-tie nightmare" elections. In contrast to range, it cannot be recommended even for honest voters. Second from left is Lowest median rank, which is like top median rating and range, only worse due to less voter expressivity, less smoothness, and more "near-tie nightmares."

Second from right is vote for and against where you vote +1 for your favorite and -1 for your most-hated candidate, and highest total score wins. The reason it looks like random dots everywhere is presumably because exact, and almost-exact, ties are exceedingly common with this method (at least in 2D scenarios with honest voters). A subjectively very similar picture happens with anti-plurality voting where you simply vote against your most-hated, and the least-named candidate wins. Again (and more obviously), ties and near-ties are exceedingly common. Both these failed methods illustrate the importance of designing your voting method so as to make ties uncommon. Finally, above on the far right is the hypothetical societally worst-possible (social utility minimizing) election method, which, it may be proved, always coincides with the "furthest point Voronoi diagram":
We do not wish to give the misleading impression that vote for and against and anti-plurality always yield a "random-dot" picture and always a tie or near tie. In the equilateral triangle and square 3- and 4-candidate symmetrical scenarios we began with, both harmlessly yield the usual picture.
Range voting with "honest" voters (who cast rescaled utilities as their range votes – rescaled so their best choice gets 99 and their worst 0) does not yield the optimal Voronoi diagram – although it usually comes close – but it does if there is some additional "ultrabad" candidate very far away (far outside the bounds of the picture frame). Here is a side-by-side comparison of Voronoi (on the left) and range (middle) but for a different random 14-point set, (69,173), (152,133), (27,164), (162,46), (27,164), (82,156), (170,30), (116,129), (49,85), (114,101), (72,41), (134,118), (106,111), (81,83), [and the utility function is 1/√(12000+Distance²) and the Gaussian has σ=70 in each direction] so you can see they differ (but not by a lot):
[Only count 13 candidates? There are 2 candidates exactly co-located at (27, 164) thanks to my brilliant random number generator...] Approval voting with mean-utility as threshold (righthand picture) also does not yield the Voronoi diagram. It obliterates many candidates and seems to favor centrists over extremists. This kind of voting can be regarded as what range voting will do but with strategic voters acting with zero information about the other voters. That illustrates the severe hit that we take when the voters become strategic rather than honest. We'll examine that topic more soon...

The 3 pictures on the right are IRV 10-candidate elections for random sets of 10 points; the middle two pictures actually are the same 10-point candidate-set but different pictures because of having different standard deviations on their voter-gaussian. Lefthand picture is the corresponding Voronoi diagram. Note the large number of disconnected and/or bizzarre-shaped win-regions, including regions with "holes." Note also the large number of "squeezed out" can-never-win IRV candidates, and the commonness of "tough call elections" (random dot clouds covering substantial fractions of the picture). Every pixel in which the Voronoi pixel color differs from the IRV pixel color, is an election where IRV refuses to elect a Condorcet ("beats all") winner.
The following pictures illustrate the effect of candidate "cloning." Here is the situation before any cloning is done:
Now clone the green candidate in the top right with 6 additional clones. [σ=100; Coordinates: (40, 40), (160, 160), (165, 169), (155, 169), (165, 151), (155, 151), (170, 160), (150, 160).]
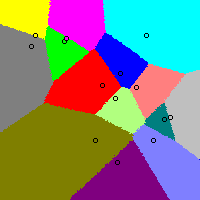
The leftmost picture is the Voronoi diagram (Optimum, Condorcet methods, Arrow-Raynaud, approval voting with oblivious threshold, etc.) which is immune to the effect of cloning. [Actually many Condorcet methods are not clone-immune – but they all are in the pictorial 2D scenarios studied here.] The very different picture second from left is Borda, which is highly vulnerable to cloning. Note how Borda's blue winning-region has shrunk drastically thanks to the cloning, to the extent where the blue candidate nearly lies outside its own winning region. (Evicting a candidate from its winning region can occur via cloning with Borda.) With Borda, a party can simply run an army of essentially identical clones to assure victory.
Second from right is Plurality voting, which also is highly vulnerable to cloning – but in the opposite manner. Plurality voting tends to "split the vote" among the clones, killing them and causing their opponent (blue) to win. Indeed, blue now wins so hugely that some of the clones diametrically opposed to everything the blue candidate stands for, have had their winning-regions entirely swallowed up by Blue and indeed now lie within the blue region – purely because their views happened to be popular! (There also are a lot of "tough call" near-tie elections, which presumably is additional "noise" caused by "spoiler" effects.) At the far right is IRV, which is a method theoretically immune to cloning. And indeed, it successfully prevents the blue region from either growing or shrinking – although it has some other problems in that it unfairly discriminates among the clones (favoring "extremists" over "centrists" as usual) and suffers a lot of "tough call" near-tie elections in which the election outcome is almost random. (Don't let anybody ever tell you that in IRV ties and near-ties are "negligibly rare.")

Above at left is Sinkhorn which seems to act like Borda but evidently is even more vulnerable to cloning. Second from left is Approval with mean-utility-as-threshold. It theoretically should have comparatively good clone-immunity; and indeed the blue region suffers only a little shrinkage – its main problem is unfair discrimination among the clones (favoring "centrists" over "extremists" as usual). Second from right is Range which is theoretically immune to cloning and indeed exhibits good performance here, aside from the usual distortion caused by voter "re-normalization" when converting utilities into range scores. That distortion vanishes if an additional "super-bad" candidate exists very far away. To illustrate that, we re-run Range with a new 9th candidate at (1400, -1400) far outside the [0,199]x[0,199] picture window (rightmost image).
Below are the four methods that (with range voting) are the best according IEVS's Bayesian regret measurements. From left to right, Range+top2-runoff, Approval(mean-based threshold)+top2-runoff, Brian Olson's IRNR system, and Chris Benham's MCA system. Technically speaking, as far as I know none of these 4 systems are cloneproof. However, as you can see they often exhibit behavior which seems a lot like a cloneproof voting method.
Below-left is Woodall-DAC, a complicated but very interesting method which we do not recommend. It may have its problems, but it has the virtue of being theoretically immune to candidate-cloning. On the right is Coombs which is not clone-immune despite its apparent similarity-of-definition to IRV (which is clone-immune):
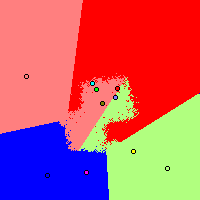
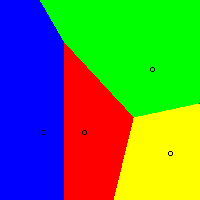
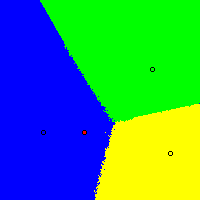
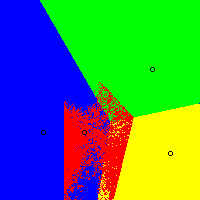
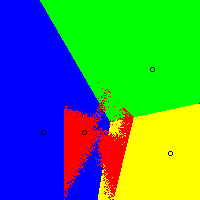
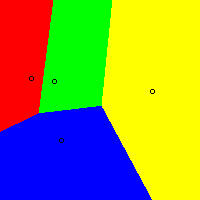
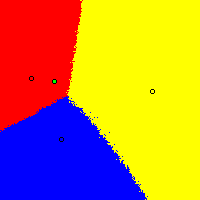
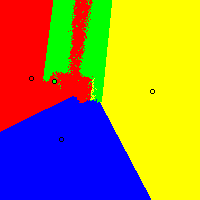
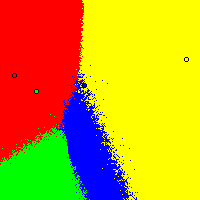
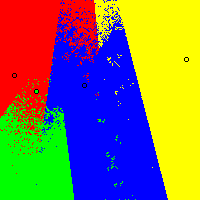
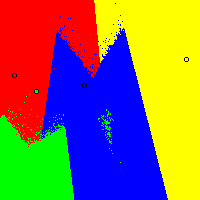
At left: the Voronoi diagram. Middle: plurality voting. At right: IRV. The candidate-coordinates are (108, 94) (154, 128) (26, 20) and σ=100. [This point set was suggested by Ka-Ping Yee.]
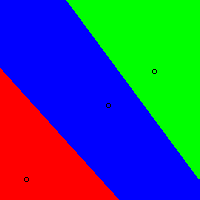
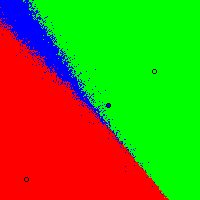
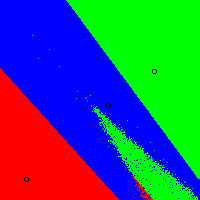
In the IRV picture, note how moving the center of society toward the blue candidate can actually cause us to leave the blue-wins region and enter a red-wins or green-wins region. That is caused by "non-monotonicity." IRV proponents often claim that non-monotonicity is a rare phenomenon in IRV elections. But as you can see from this and other IRV pictures, it isn't all that rare.
The plurality picture illustrates maximally simply how the blue-wins region can fail to contain the blue candidate. Indeed, one can construct 3-candidate plurality elections in which the blue-wins region is arbitrarily far-separated from the blue candidate.
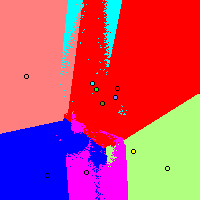
From left to right: Voronoi, Plurality, IRV and IRV again but now with many more (about 40000) voters per election (each pixel is one election). As you can see, IRV yields a rather peculiar-shaped red win-region. This also illustrates a common phenomenon in IRV elections that I call the "shadow world." That is, the win regions in IRV are polygonal, but you often get shadowy polygonal regions filled with random dots kind of lying on top of real regions. These "shadow" regions go away when you vastly increase the number of voters per election, making it clear they are caused by "noise" due to "tough-to-call" elections. However, it is often difficult to tell (without enormous computer time expenditure) which regions are "real" and which are "shadows." In the present case it takes about 200,000 voters per election before the boundaries in the picture finally appear crisp (the shape from the 40000-voter picture is genuine). In practice, elections in the shadow regions would have almost-random outcome or would lead to election administration "chad counting" nightmares. [Coordinates: (43, 67), (152, 130), (84, 67), (170, 46); σ=100.]
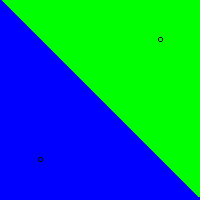
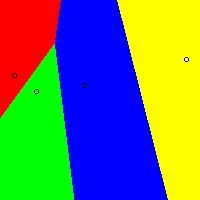
The three pictures below from left to right: Voronoi, Plurality, and IRV. Both this and the above picture illustrate how plurality elections with honest voters can "squeeze out" a candidate, unfairly preventing it from winning anywhere. Also, we have below two examples in the same picture of IRV featuring two-component disconnected win regions (for green and yellow) – and the green candidate does not even lie inside its own win-region. [Coordinates: (61, 60), (54, 118), (31, 121), (152, 108); σ=100.]
Below from left to right are Voronoi, Plurality, IRV, and IRV again now with many more (about 40000) voters per pixel-election. Two of the plurality winners lie outside their win-regions. The rightmost IRV picture demonstrates something truly amazing – a win region containing a hole with no apparent reason for existing. The blue sea contains a triangular green "island." Why is it there? The green candidate is not anywhere near, indeed it lies outside both the blue and green win-regions. Yee has verified that the green island is genuine (indeed, with 200,000 voters per pixel, it crispens up and becomes somewhat larger), not a fake "shadow." However, that is far from clear from the "shadow world" situation in the first IRV picture. This island has the property that the more voters you use per pixel, the larger and clearer it appears. Every election in the island is "tough to call" and the situation only clarifies when many votes are counted. [Coordinates: (84, 114), (36, 108), (14, 124), (186, 140); σ=100.]
"Squeeze out" is not a problem solely afflicting plurality voting. It can also occur with IRV. Below on the left is Voronoi, middle is IRV and on the right is Plurality; the centrist yellow candidate loses everywhere under both IRV and Plurality (honest) voting. [Coordinates: (40, 40), (160, 40), (109, 150), (95, 47); σ=130.]