(Executive Summary) (Return to main page)
Scientific and technological innovation has historically occurred at a much greater rate (over 10× larger) in democracies than non-democracies. (Click the blue hyperlinks above to find out more.)
Under capitalism, man exploits man. Under communism, it's just the opposite. – John Kenneth Galbraith
During 1945-1990, the cumulative effect was that by 1990 productivity per worker in E.Germany had shrunk to about half that in W.Germany, representing the compounded effect of economic growth being additively 1.5%/year smaller. This is taken from Bailey's book.
Bailey (an economist) estimates that USA Government spending gets 50 cents value per dollar spent, for "50% waste." (This estimate is necessarily rather crude. He has numerous examples in chapter 1 summarized on his page 13 in table 1.3.) If so, improved systems for military spending decisions, farm subsidies, medicare, etc etc could improve the economy by a lot, because the US Government taxes and spending (if we include all state and local governments and Social Security) constitute 30-35% of the USA's GDP.
The above estimates suggest that very considerable economic improvement could be possible by changing the sort of government we have.
During this [the 20th] century's wars, there were some 38 million battle deaths, but almost four times more people – at least 170 million – were killed by governments for ethnic, racial, tribal, religious, or political reasons. I call this phenomenon democide, and it means that authoritarian and totalitarian governments are more deadly than war. – R.J.Rummel, author of Death by GovernmentSee also Rummel's "power kills" web site and his statistics of democide notes. Rummel's current estimates are higher than this quote. One of Rummel's points is that democide deaths far outnumber (by a factor>4) both ordinary war deaths and ordinary homicide deaths. Another is that nearly 99% of democide deaths occur in non-democracies. Rummel also cites data from, e.g. Richard Pride indicating democracies do not war with each other, or very rarely. By Pride's definition of "democracy," during 1920-1965 there were 1540 dyads of countries with 192 having wars ("war" defined as >1000 combat deaths) and 91 involving a democracy, but none were between democracies.
Here is table 1.2 (page 5) of Bailey's book attempting to exhibit the effect of democratization on the economies of four countries.
| Chile | Ghana | Mauritius | Turkey | |
|---|---|---|---|---|
| Pre-liberalize | 2.6 | 1.5 | 3.1 | 5.2 |
| Post-lib | 4.9 | 4.5 | 5.5 | 5.9 |
| year of switch | 1975 | 1983 | 1980 | 1983 |
This by itself, however, is unconvincing evidence that democracy is economically good. I say that because
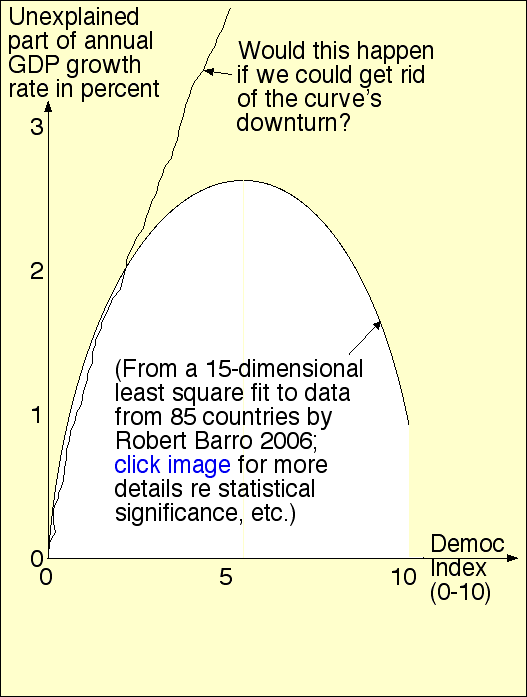
(jpg version of same picture)
Barro's book attempts to predict the growth rate of a country's real GDP from various facts about that country. Barro found that GDP growth is enhanced by:
But democracy increases GDP in a somewhat peculiar way (pictured): increases in Barro's political rights index from 0 to 5.6 on a scale of 0-10 (yielding a moderate level of freedom and democracy) increased GDP growth rates additively by 2.6% but a further increase in the index from 5.6 to 10 retarded growth by negative 1.6%.
All of Barro's causative factors (listed) cause approximately equal additive effects on predicted real-GDP-growth-rate, namely about 2-5% each. That is, having the optimum level 5.6 of political rights causes about 2.6% higher (additively) annual GDP growth rate than the pessimal level 0; countries about one standard deviation above usual in education levels are predicted to have about 3% higher than usual annual-GDP-growth; etc.
Obviously, compound interest will convert these into enormous eventual prosperity differences, which is an important reason why rich countries are tremendously richer than poor ones.
Another book-length study based on least-squares fitting is Vanhanen's. (And it is even bigger than Barro's study, employing over 170 countries.) The difference is that while Barro focuses on finding factors that cause increased GDP growth rate, Vanhanen focuses on factors causing increased democracy.
The two are related; thus Vanhanen finds that more education (especially early education, according to p.68 of Barro) and more prosperity both cause more democracy. Thus Vanhanen's plot on p.77 of his "Prospects" book shows GNP/capita predicts index of democracy highly effectively (year 1991 data, 172 countries, correlation is 0.62). The UN's "human development index" also is an excellent predictor of democracy-index (plot p.79; correlation=0.67).
A correlation is not the same thing as a certainty so democracy does not force a good economy. For example, China is doing better than India economically. But on average, democracy is a superb correlate. Vanhanen's key umbrella finding is that wider distribution of power resources is the key enabling factor for democracy. (In particular, we might expect from this that greater concentration of wealth, i.e. greater inequality as measured by "Gini index," would predict and cause a diminution of democracy. However, Barro p68-72 finds only a very small correlation [0.02] – Gini index is not a good enough gauge for Vanhanen's purposes.)
Advocates of democracy should be distressed that further increases in democratic political rights make the economy worse. The initial upward trend of the curve makes a great deal of sense to them – but why the downturn?
Barro tries to explain it by postulating that more democracy causes more government income redistribution, which hurts growth. However, that explanation is attackable because Barro's fit already had incorporated government expenditures as a different predictor, and democratization was only being fit to the unexplained part of the GDP growth above and beyond that explainable as a result of government outlays. In other words we are predicting the effect of democratization on GDP growth with government purchases held constant. (Also educational attainment and life expectancy are also held fixed, which also are related somewhat to government outlays; and everything else Barro looks at, such as initial GDP/capita, also is held fixed.) Barro partially defends himself by saying that government transfer payments were not held constant. But, assuming Barro has in mind the idea that the transfers aim toward equalizing wealth, he is exactly wrong about its economic effect: the Deininger-Squires 1998 World Bank cross-country study found that greater initial inequality is strongly negatively correlated to future economic growth!
In other words, the "trickle down theory" often associated with Ronald Reagan is wrong. And according to George R. G. Clarke: More Evidence on Income Distribution and Growth, J. Development Economics 47,2 (Aug. 1995) 403-427, "This conclusion is robust across different inequality measures, and to many different specifications of the growth regression. Furthermore, inequality appears to have a negative effect on both democracies and non-democracies. Interaction terms between inequality and regime type, when included in the base regression, do not affect the sign or significance of [this]." So this seems to settle the matter. (However, to completely clarify matters, it would be good to put transfer payments into Barro's fit also, to see what happens. And two other good predictors to try inserting would be a country's winter temperature and the "centralization fraction" of its government [See A.Lijphart: Democracies 1984 table 10.2 page 178].)
Therefore, let us propose some new explanatory hypotheses that we think more supported than Barro's:
In other words, quite possibly, Range Voting would lead to a greater economic win, i.e. a greater improvement in humanity's lot, than anything else Barro could identify, and it would be an easier change to make too.
Hello.
Our Bayesian regret study predicts that switching from plurality to range voting will bring benefits comparable to those got from switching from non-democratic systems modeled by "random winner" to plurality-voting democracy. This study was totally independent of Barro's and used entirely different (non-economic, computer simulation based) methods. That also predicts a huge win from adopting Range Voting.
It would be good to do a cross-country study trying to measure the economic impacts of different kinds of voting systems. This would be deeper than merely considering "democratic" versus "not." However, at present, few such studies have been done, focused mainly in the question of which is better: Proportional Representation or "majoritarian" democracy – and mainly with inconclusive conclusions. (Also see problem 14.)
One very interesting study was the 2005 quality of life survey by The Economist magazine (more extensive pdf). This study tried to estimate, not just how wealthy a country was, but (which is related but not the same) the quality of life for its inhabitants. (See the links for how that was estimated and defined.) It found the top 10 countries were (in decreasing-quality order) Ireland, Switzerland, Norway, Luxembourg, Sweden, Australia, Iceland, Italy, Denmark, and Spain. (The USA, Canada, and Qatar, were ranked 13, 14, and 41; they did not make it into the top quality-of-life 10 despite GDP/capita ranks of #2, #5, and #6 respectively.) What do the top-10 have in common?
The fact that neither PR nor non-PR (mainly plurality-voting-based) democracies exhibit obvious economic superiority over the other suggests that a democracy based on range voting could be significantly superior to either.